

Welcome back to another issue of Recent Academic Research!
Let’s get into it.
The Stock Market Never Learns
Halperin borrows a tool from AI research to watch how the entire stock market’s correlation structure moves over time, and finds that unlike a neural network, the market never settles into a stable pattern, even decades after a crisis passes.
The core idea here is clever: treat the whole S&P 500 like a machine learning model in training, and watch whether its “internal representation” (the correlation structure between all 500 stocks) ever stabilizes the way a trained neural network’s does. It never does. Across three crises (the 2001 dot-com bust, 2008, and 2020), the market’s correlation geometry collapses in dimension during a crash, as everyone starts moving together, then partially unwinds afterward, but never settles into the kind of clean, learned structure you’d see in a model that’s finished training. Separately, Halperin ranks stocks by relative performance and volatility each day and tracks those rankings as their own systems. Performance rankings shuffle fast (a week), while volatility rankings are sticky (a month or more), and only the volatility ranking shows a real “arrow of time,” meaning it behaves differently forwards than backwards, flaring hardest at the 2002 and 2008 lows. For investors, the practical takeaway is: the correlation-based fragility signals only gave advance warning for 2008, the slow-building crisis. They were blind to Covid.
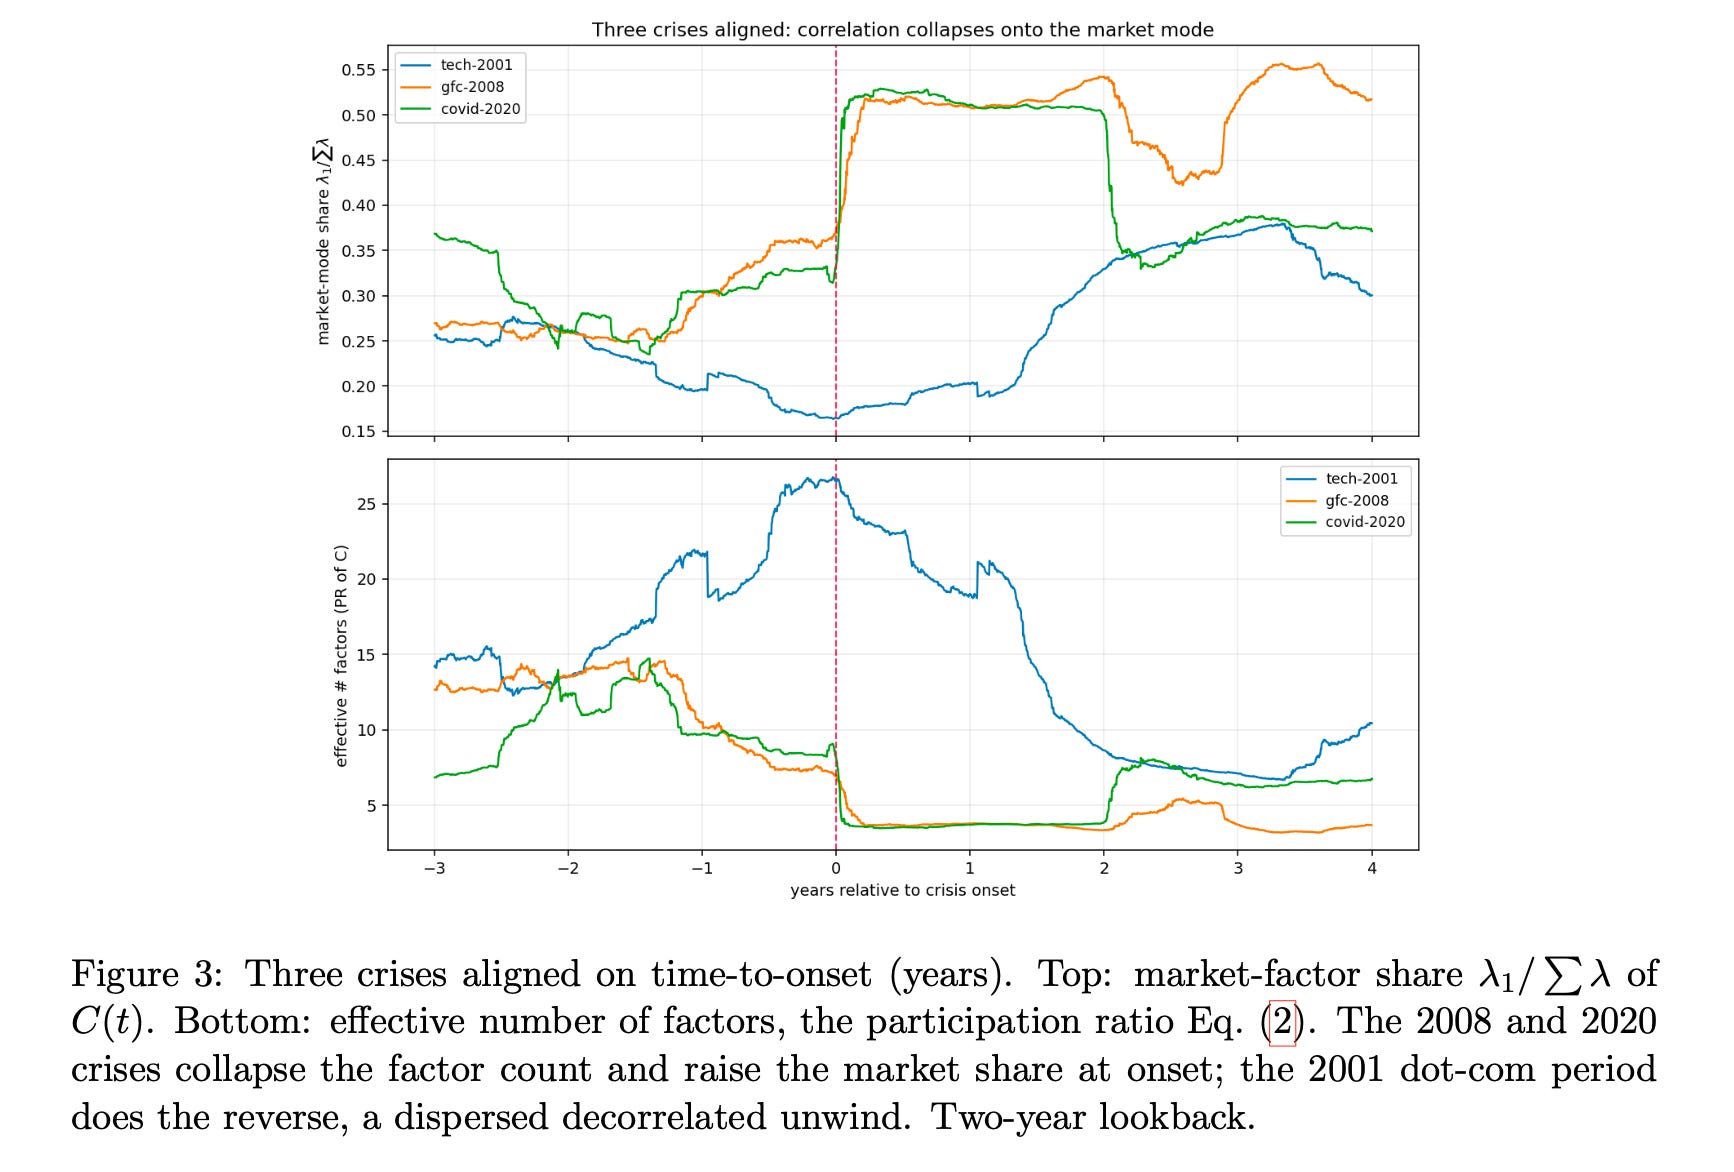
As Halperin puts it, the market is best read as an object that a crisis “drives further from equilibrium rather than toward a new one.”
Halperin, Igor, Observable Matrix Dynamics of Stocks (July 20, 2026). Available at SSRN: https://ssrn.com/abstract=7149898 or http://dx.doi.org/10.2139/ssrn.7149898
Why a Yen Funding Rate Half a World Away Moves the Price of U.S. Corporate Debt
Japanese banks fund roughly a quarter of America’s CLO market through yen-dollar swaps, and the cost of that swap, not U.S. credit conditions, is what actually drives pricing at the top of the capital structure.
Here’s the setup that makes this paper fun: Japanese banks, led by the agricultural cooperative bank Norinchukin (nicknamed “the CLO whale”), hold about a quarter of all AAA-rated U.S. collateralized loan obligations. But they don’t fund those purchases with dollars, they fund them by swapping yen into dollars through FX derivatives. That swap has a price, called the cross-currency basis, and it turns out to explain over 60% of the quarterly variation in CLO issuance, more than VIX, credit spreads, or any domestic macro variable the authors threw at it.
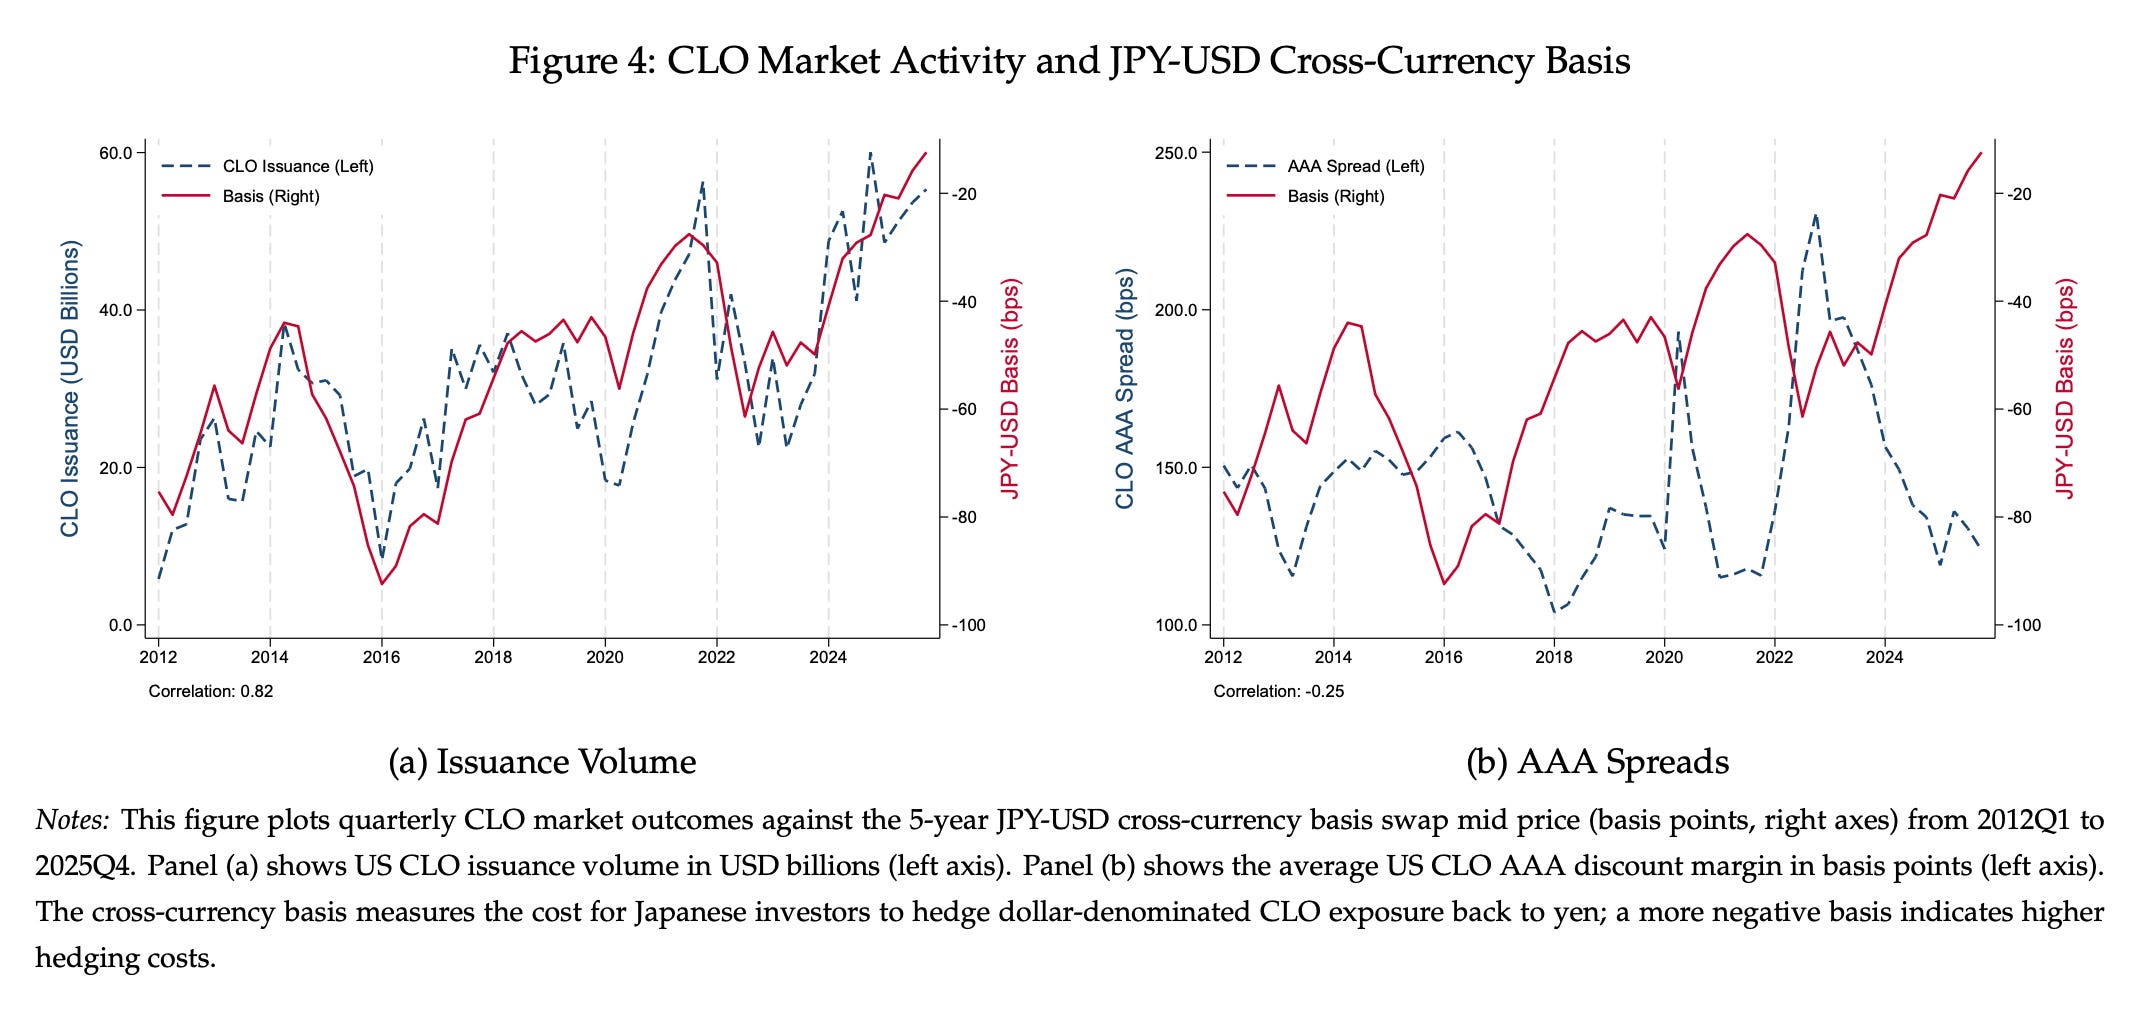
The real hook, though, is that this sensitivity isn’t stable. After Japan tightened bank capital rules in 2019, the pass-through from funding costs to AAA spreads roughly tripled, because the shock pushed the price-insensitive whale out and let more rate-sensitive buyers set the margin. That’s a good reminder that “foreign ownership share” is a lazy proxy for exposure. What matters is who’s marginal, and how easily they can walk away.
Huber, Amy and Kundu, Shohini, When Funding Markets Move Credit Markets: Foreign Investors and U.S. CLOs (May 15, 2026). Available at SSRN: https://ssrn.com/abstract=7086758 or http://dx.doi.org/10.2139/ssrn.7086758
Deep Hedging Finds Free Money
A neural network trained to hedge derivatives will, if left alone, quietly convert itself into a leveraged bet on the market’s historical drift rather than an actual hedge.
Deep hedging replaces the classic quant approach of assuming a price model (Black-Scholes, Heston, etc) and deriving a formula, with a network that just learns the best trading policy directly from simulated or historical paths, optimizing for a risk-adjusted objective rather than a textbook Greek. The elegant idea, borrowed from Buehler and coauthors, is that “the price of a derivative is the cost of its hedge,” so if you can learn the optimal hedge, you’ve also learned the fair price. The catch shows up fast: when the author trained this framework on S&P 500 data from 2015 to 2025, the network didn’t learn to hedge options responsibly, it learned to go long the index, sell puts, and mostly ignore the derivative it was supposed to be hedging, because that combination was simply the highest-Sharpe trade over that specific decade.
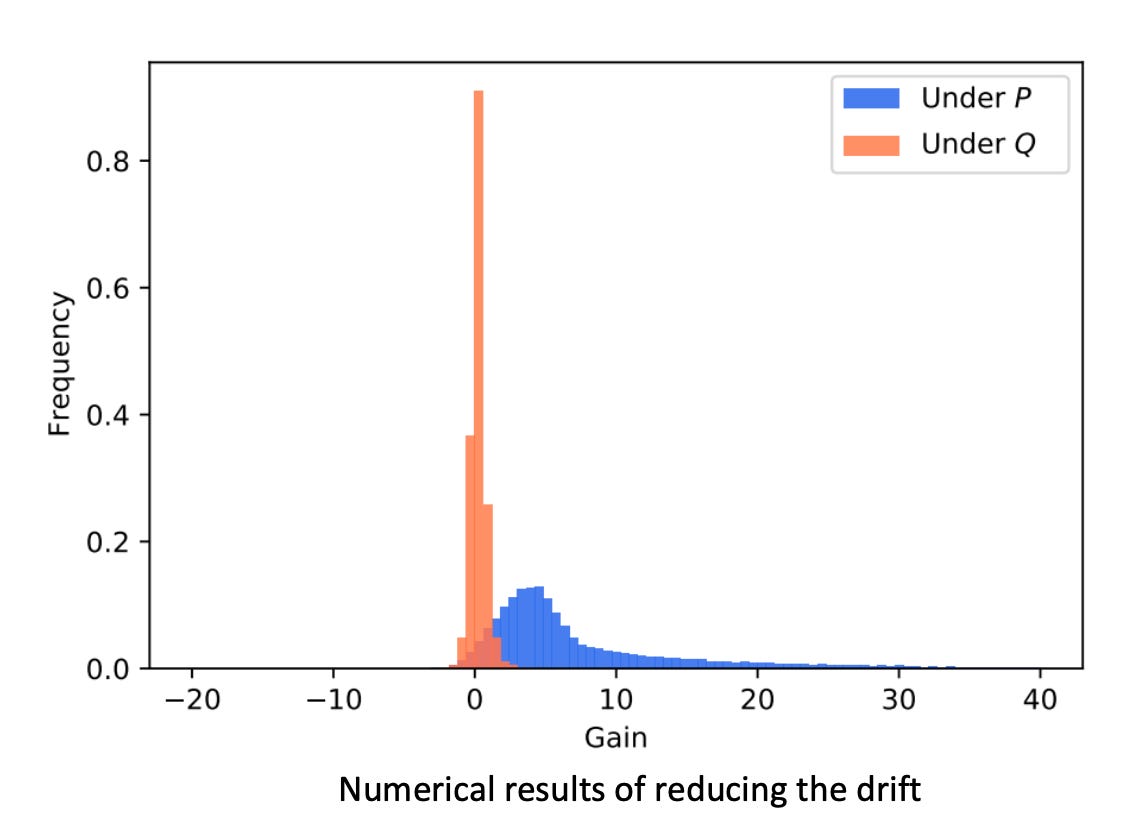
Figure 2: shows the distribution of trading gains “Under P” (raw historical drift) versus “Under Q” (drift-adjusted, risk-neutral measure), which visually demonstrates how removing the statistical arbitrage collapses the fat right tail into a distribution centered near zero.
The fix involves reweighting the training paths into a new probability measure that strips out the drift, forcing the model to actually hedge instead of quietly rediscovering “stocks go up.” It’s a clean reminder that any backtested strategy, human or machine, can mistake a decade’s tailwind for genuine skill.
Buehler, Hans, (Deep) Learning to Trade II - Deep Hedging, Model Uncertainty, Deep Bellman Hedging (March 18, 2026). Available at SSRN: https://ssrn.com/abstract=7086438
A Machine That Draws Arbitrage-Free Options Markets, and Then Learns to Simulate Them
A weighted sum of Black-Scholes prices, fit with plain linear programming, can capture an entire options market’s shape without ever creating a mathematical arbitrage, and once encoded into just twenty numbers, that shape can be simulated forward in time under a risk-neutral measure.
Building a model of the options market has always meant a tradeoff. Flexible models fit reality poorly, while accurate ones (like local volatility) are painfully hard to compute and calibrate without human babysitting. This paper’s answer, called SANOS, sidesteps the mess entirely by expressing every option price as a weighted mix of simple Black-Scholes prices across a grid of strikes. Because that structure is mathematically guaranteed to avoid static arbitrage, fitting it becomes a fast, off-the-shelf optimization problem rather than an art project, and in testing it priced 91.4% of real SPX options within the bid-ask spread, in well under a second.
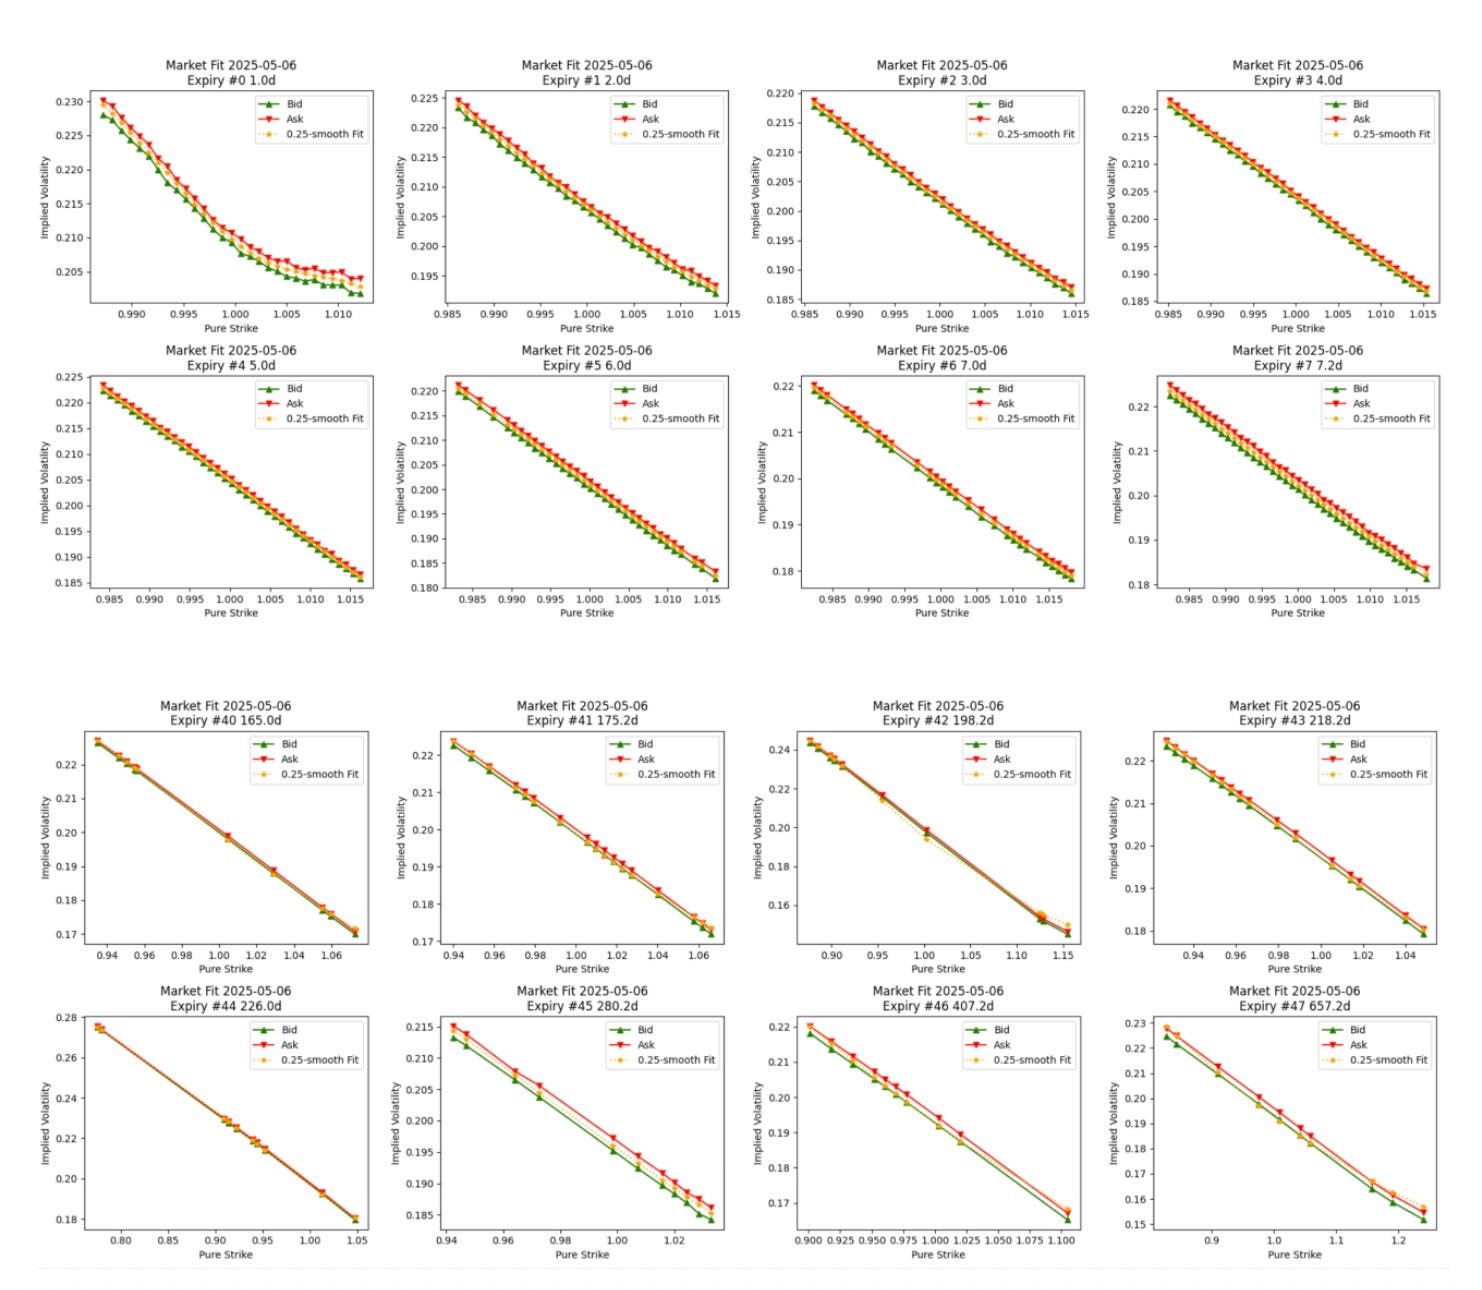
Note: Fitted 1000 options within 2 ATM implied volatility standard deviations which had a Vega/sqrtT of at least 0.1% on 2025-05-06 across all 48 expiries from 1D to 657 business days. Options were chosen by closeness to ATM. The model fitted 91.4% of all options within bid/ask. Of those options not fitted the median error is just 21% of half spread.
The authors then compress five years of these fitted surfaces into a 20-number daily state, run PCA to find just five real drivers of surface dynamics, and use that to simulate future markets. As they put it, once set up, “it is fast.” For traders, this means a genuinely tractable way to stress-test strategies against markets that behave like the real thing, without hand-tuning a volatility surface every morning.
Buehler, Hans and Horvath, Blanka and Kratsios, Anastasis, DYSANOS - Generative Dynamic Smooth Arbitrage-free Non-parametric Option Surfaces (Presentation) (July 01, 2026). Available at SSRN: https://ssrn.com/abstract=7047878 or http://dx.doi.org/10.2139/ssrn.7047878
This week for paid subscribers
This week, paid subscribers get full access to a special two-part deep dive on pricing spread options and forecasting correlation when traditional models fail. Part 1 covers the pricing machinery and where standard approximations break down, while Part 2 tackles the hidden risk of correlation instability and how to actually select your parameters. Both posts include complete Python backtest code and historical datasets so you can run the entire pipeline yourself.
Part 1:

Part 2:

Disclaimer: The content provided in this newsletter, “Alpha in Academia,” is for informational and educational purposes only. It should not be construed as financial advice, investment recommendations, or an offer or solicitation to buy or sell any securities or financial instruments. Past performance is not indicative of future results. The financial markets involve risks, and readers should conduct their own research and consult with qualified financial advisors before making any investment decisions.
The interpretations, opinions, and analyses presented herein are those of the author and do not necessarily reflect the views of the original researchers, their institutions, or the full implications of the cited academic papers. While every effort is made to accurately represent the research discussed, readers should be aware that the summaries and interpretations may not capture the full scope or nuances of the original studies. The information contained in this newsletter is believed to be accurate and reliable at the time of publication, but accuracy and completeness cannot be guaranteed. The author and publisher accept no liability for any loss or damage resulting from reliance on the information provided.
This newsletter may contain links to external websites or resources. The author is not responsible for the content, accuracy, or reliability of these external sources.
By subscribing to or reading this newsletter, you acknowledge that you have read and understood this disclaimer and agree to hold the author and publisher harmless from any liability that may arise from your use of the information contained herein.