

Hello and welcome back to another paid post!
Yesterday we built three ways to price a spread option and found that the pricing machinery is not the problem. Kirk’s approximation is accurate to a few basis points in the region where it actually gets used.
We ended on the thing that is the problem. A spread option’s price depends on the correlation between its two legs about as much as it depends on either leg’s volatility. But unlike volatility, correlation has no market, no implied surface, and no vocabulary for expressing how unsure you are. It’s a number someone types into a box.
Today: which number, and what the choice costs.
Let’s dive right in.
How Much Does It Actually Move?
The case for treating correlation as a fixed parameter is that it does not wander much. Volatility clusters and spikes, but two things that are economically linked (crude oil and the fuels made from crude oil) ought to stay linked.
Over our sample, the sixty-day rolling correlation between crude and the 2:1 product basket has a full-sample value of 0.677. That single number is the one most likely to end up in the box.
Here is what the rolling estimate actually did.
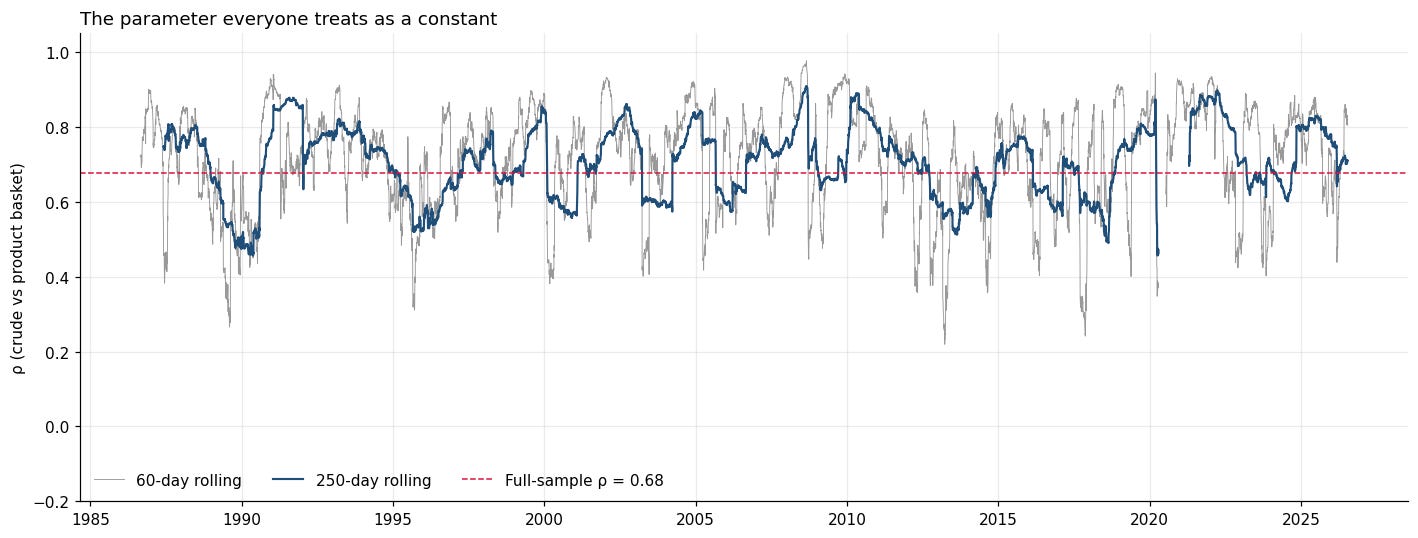
Figure 1: Sixty-day and 250-day rolling correlation between crude and the product basket, 1986–2026. The dashed line is the full-sample value a model would typically use.
The sixty-day estimate ranges from 0.22 to 0.98, nearly the entire theoretical span. And the departures are not brief excursions around an otherwise stable mean. The rolling correlation sits more than 0.15 away from the full-sample value on 33.7% of all trading days.
Put differently, for a third of the past forty years, the number in the box was wrong by an amount we are about to put a price on.
What That Range Is Worth
A parameter wandering between 0.22 and 0.98 only matters if the price cares. So take our three-month at-the-money crack spread option, hold both volatilities fixed at their forty-year values, and change nothing at all except the correlation.
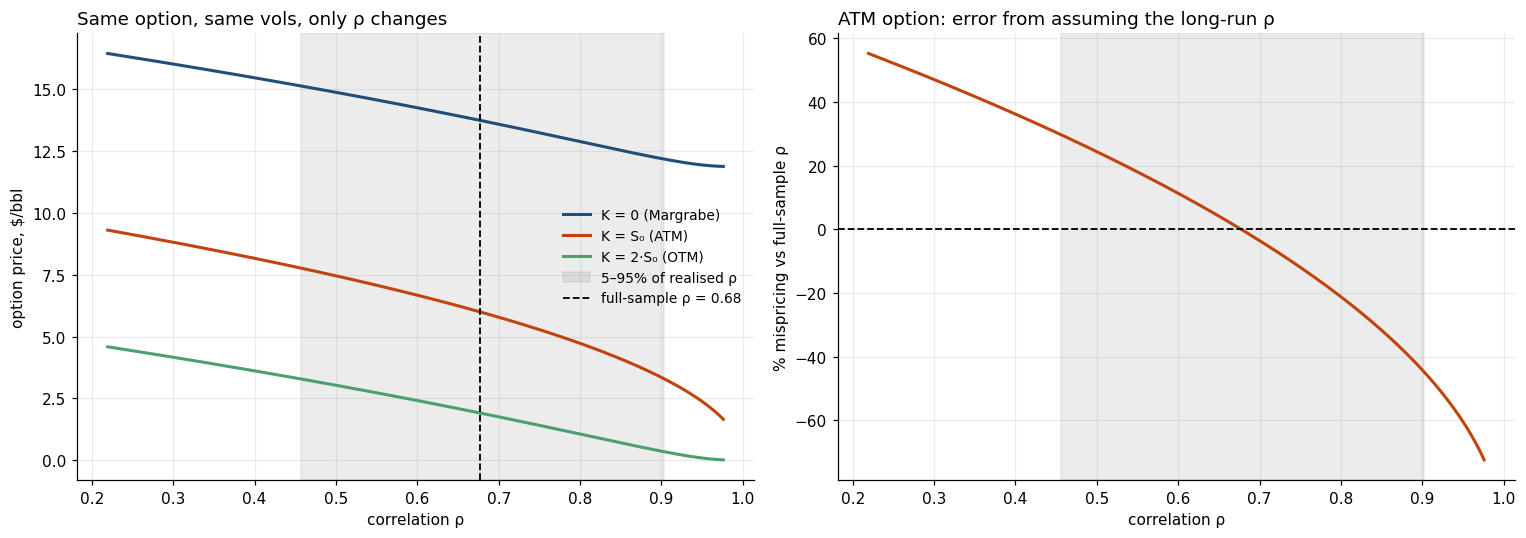

A 5.6x range. Same strike, same expiry, same volatilities, same underlying. The entire difference is an assumption.
And that is not a point made with implausible extremes. Restricting to the middle of the distribution (5th to 95th percentile of what correlation has actually done), the same option still spans $3.30 to $7.78, a factor of 2.4.
So, which number do you type in? Before answering that, it is worth understanding one property of this correlation, because it turns out to explain more than it looks like it should.
Does Correlation Really Spike in a Crisis?
There is a well-documented result in equity markets that correlations rise in a downturn. Diversification thins out precisely when it is wanted, because in a sell-off individual names stop trading on their own news and start trading on the market’s.
The question is whether that transfers here. A crack spread is not a portfolio of equities. It is one commodity against the fuels refined out of it, and the link between them is a physical production process rather than a shared risk appetite. So it is genuinely unclear, before looking, whether the same pattern should hold.
We can check directly. Split every day in the sample into five buckets by the prevailing crude volatility, from calmest to most stressed, and see what correlation was doing in each.
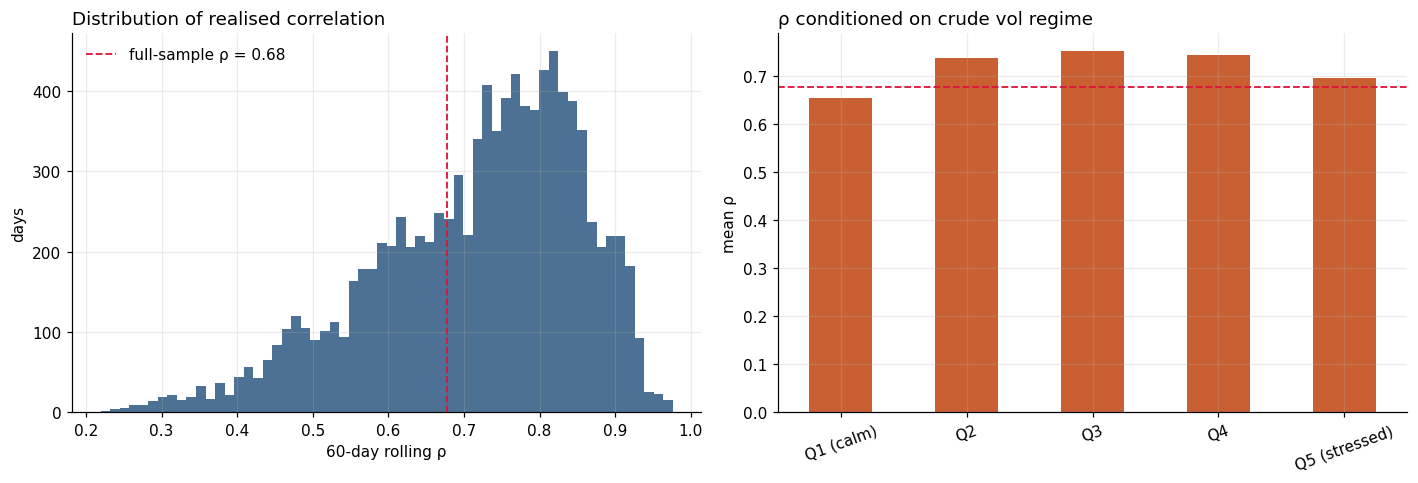

Correlation rises from calm into the middle of the distribution, which is the equity pattern working as advertised. And then, in the most stressed quintile, where crude volatility averages 61% annualized, three times the calm regime, it falls back to 0.696, below the mid-regime level. The dispersion widens too: the standard deviation of ρ is at its highest, 0.148, exactly where you would want it lowest.
So the shape is a hump, not a ramp. The equity intuition holds through ordinary stress and then inverts in genuine crisis.
The mechanism is not mysterious once you look at the individual events. In a real dislocation crude stops trading on the same information as the products. April 2020 is the cleanest illustration in the sample: crude collapsed on a storage constraint, a mechanical problem about where to physically put barrels, while gasoline and diesel kept tracking actual fuel demand. On the day WTI printed −$36.98, gasoline was still trading comfortably above zero. The legs had decoupled entirely.
Hold onto this finding. It looks like a piece of trivia about crisis behavior, and it turns out to be the reason the standard way of estimating correlation is biased.