

Welcome back to another issue of Recent Academic Research!
Let’s get into it.
Social Security's Debt Problem Isn't Aging, It's Architecture
Social Security’s growing contribution to the national debt has less to do with an aging population than with benefit design choices made decades ago.
Boccia and Nachkebia’s central claim is that demographics get too much blame. Yes, the worker-to-beneficiary ratio has collapsed from 16-to-1 in 1950 to roughly 3-to-1 today, but the deeper problem is that Congress built in structural cost growth on top of that: early cohorts got outsized windfalls relative to what they paid in, wage indexing (adopted in 1977) mechanically raises each new retiree’s initial benefit faster than inflation, and the inflation measure used for annual adjustments overstates true cost-of-living increases. The result is $1.5 trillion added to federal debt since 2010, with another $3.4 trillion projected by 2032.
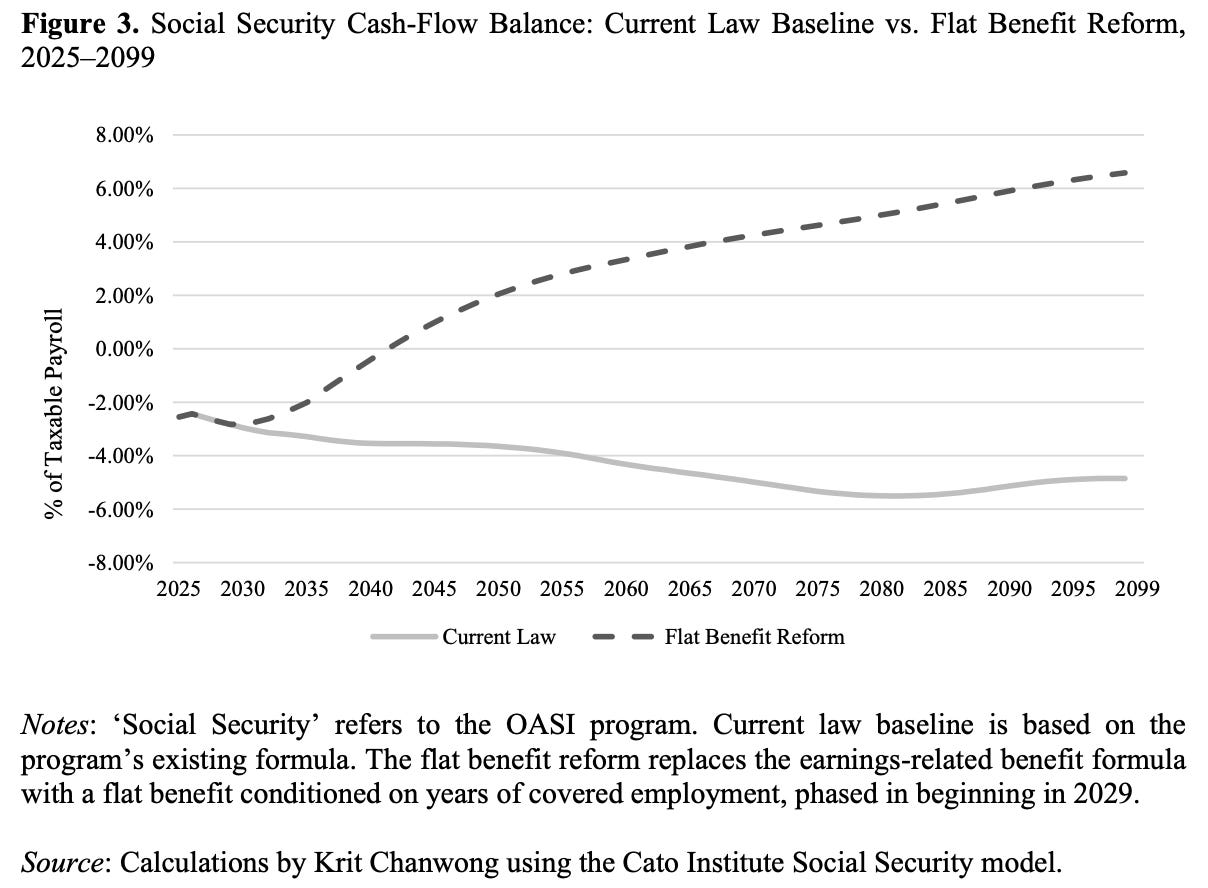
The authors test whether stronger economic growth alone could dig the program out, and it can’t, even at real wage growth nearly double the baseline assumption, deficits persist through 2099. As they put it, “neither faster economic growth nor higher inflation can, by themselves, close Social Security’s funding gap.” For investors, that’s a signal that the fix will have to come through legislated benefit or tax changes, not a growth surprise, which has direct implications for long-duration Treasury demand and fiscal risk premia.
Boccia, Romina and Nachkebia, Ivane, Social Security's Role in the Federal Debt Explosion: Past, Present, and the Reform Imperative (August 19, 2026). Wharton Pension Research Council Working Paper No. 2, Available at SSRN: https://ssrn.com/abstract=7315578 or http://dx.doi.org/10.2139/ssrn.7315578
The Sector Rotation Everyone Trades Isn't Actually There
The classic growth-leads-defensive sector rotation, a staple tactical signal, turns out not to be a real cross-sector relationship at all, it’s the market factor reaching defensive stocks a day later than it reaches growth stocks.
Traders have long used the fact that cyclical sectors like tech and industrials seem to move a day ahead of defensive sectors like utilities and staples as a timing signal. This paper tests whether that lead-lag is a direct link between sectors or just two sectors reacting to the same market move at different speeds. Once they strip out the shared market factor, the rotation disappears almost entirely, and two placebo checks confirm this isn’t just an artifact of over-controlling. What’s left is a market factor that reliably leads defensive sectors, concentrated almost entirely in low-diversification, high-stress periods, and largely absent in calm markets.
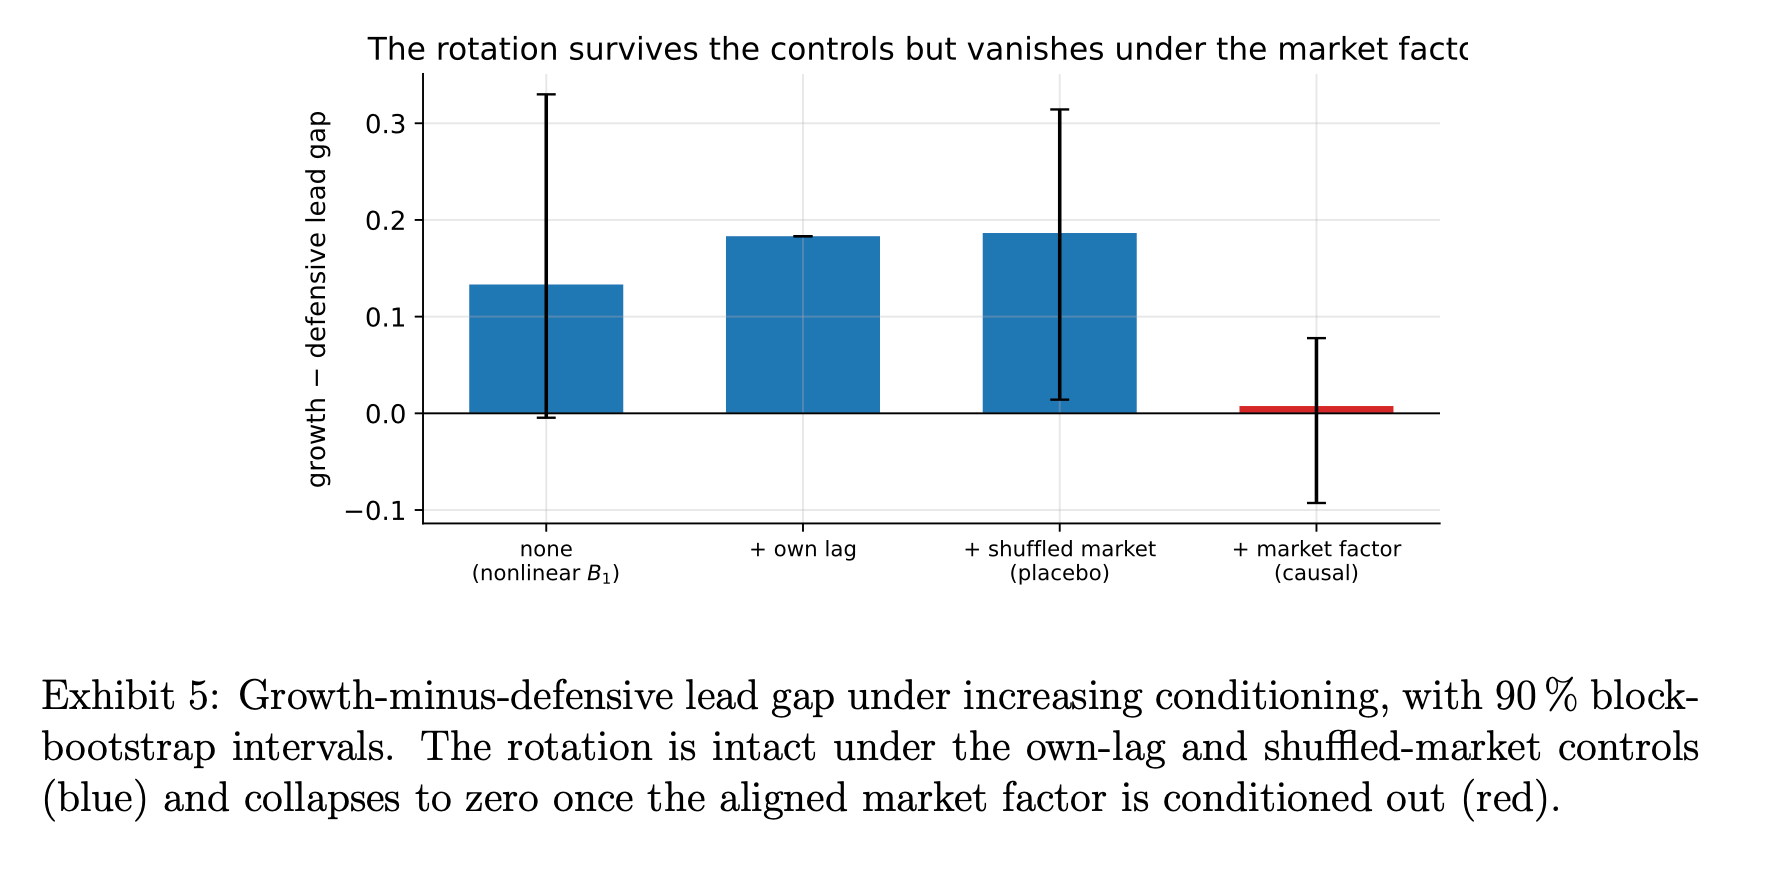
As the authors put it, “it is not a direct causal signal.” For anyone running a rotation overlay, this means the strategy isn’t harvesting a diversifying edge, it’s a leveraged bet on market direction that only pays off during stress, and should be sized and risk-managed accordingly.
Sudjianto, Agus and Setiawan, Sandi and Narain, Arpit, Is Sector Rotation Causal? A Geometric Test of the Growth-to-Defensive Lead-Lag (August 18, 2026). Available at SSRN: https://ssrn.com/abstract=7313339 or http://dx.doi.org/10.2139/ssrn.7313339
When Everyone Trades the Same Signal, the Market Can Get Stuck With Two Right Answers
Two portfolios can crowd each other out just by watching the same data, even if they never touch the same stock, and past a measurable tipping point the market stops having one correct price and starts supporting several self-fulfilling ones instead.
This paper draws a distinction most crowding research skips: there’s crowding from holding the same positions (which market impact already prices) and crowding from conditioning on the same drivers, like everyone running a regression on the same handful of macro series. That second kind erodes returns even when portfolios never overlap in what they actually own. The more interesting result is what happens once enough capital piles onto correlated signals: the author derives a single dimensionless statistic, built from cross-impact, covariance, and deployed capital, that tells you which regime the market is in. Below a threshold of one half, prices are pinned down uniquely. Above it, the same fundamentals can support a whole family of self-confirming “conventions,” essentially coordinated mispricings that persist because everyone trading them keeps them true.
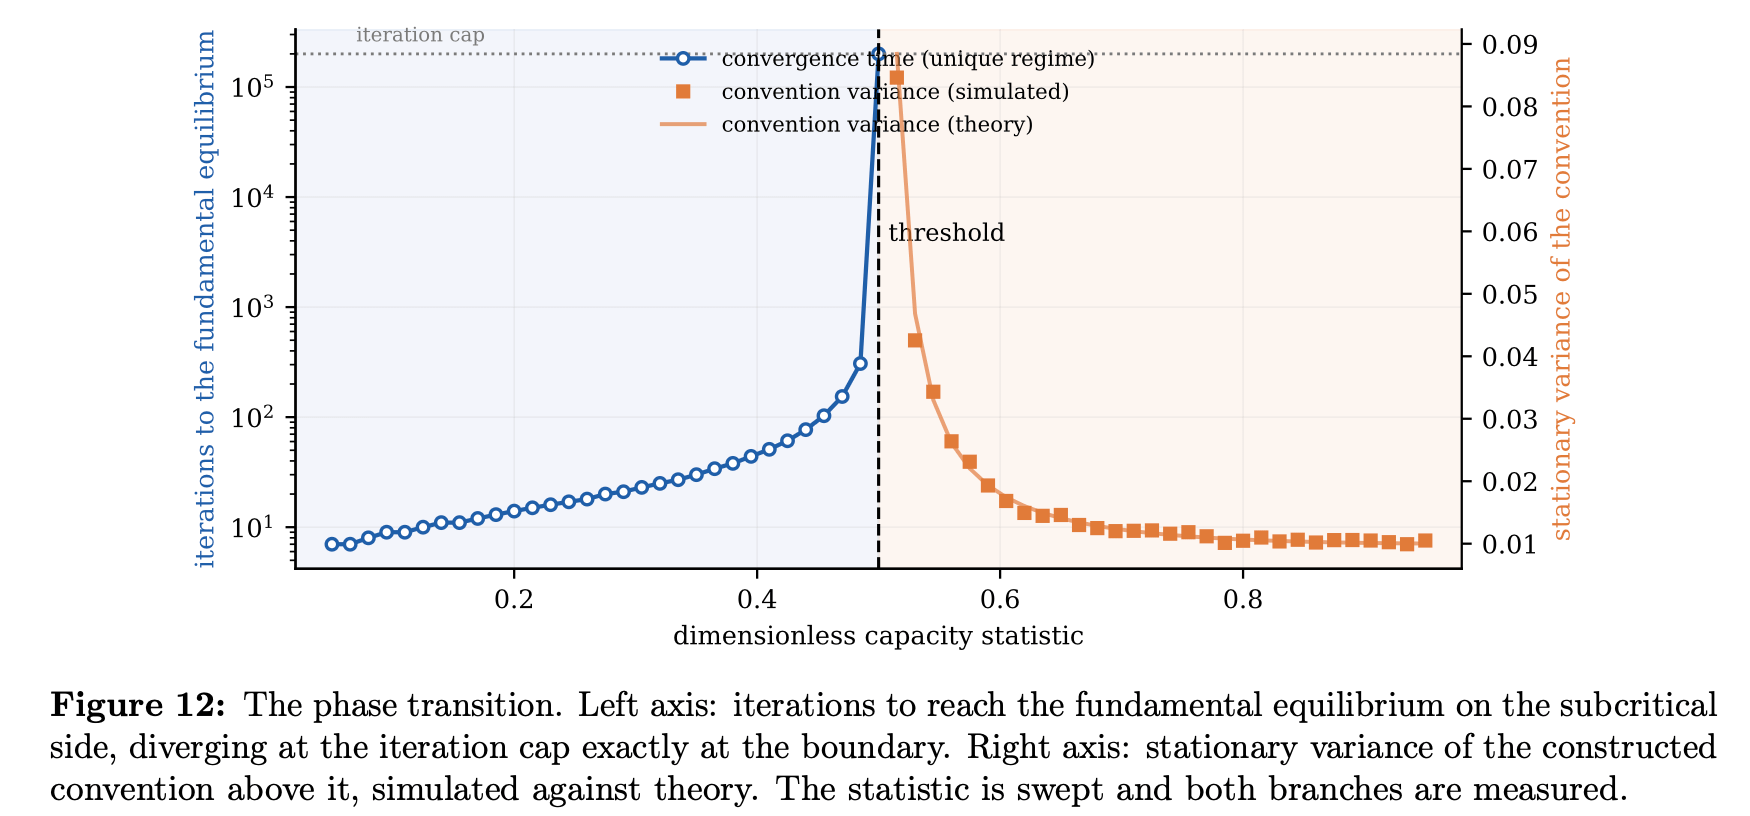
The author’s own S&P panel test finds a modest but real signature of this crowding, stronger when borrowing costs (a proxy for short-selling pressure) are elevated. For investors, it’s a formal argument for why popular factors can go quiet for years and then break down all at once: the market isn’t drifting, it’s approaching a threshold.
Rodriguez Dominguez, Alejandro, The Market's Conditioning Representation: Equilibrium, Crowding, and Convention Multiplicity (August 09, 2026). Available at SSRN: https://ssrn.com/abstract=7309320 or http://dx.doi.org/10.2139/ssrn.7309320
VIX Is a Great 22-Day Forecaster and a Mediocre 66-Day One (And Recalibration Only Half-Fixes It)
Goyle and Revtsov ask a deceptively simple question: does the options market’s forward-looking volatility estimate actually help predict how much S&P 500 leveraged ETFs will drift from their stated daily multiple over time. The answer depends entirely on how far out you’re looking. At 5 and 22 trading days, raw VIX is a genuinely strong predictor of realized variance, easily beating both a historical average and a HAR-style model built from past volatility alone. But stretch the horizon to 66 days (roughly a quarter) using VIX3M, and the raw signal collapses, actually performing worse than just guessing the historical mean. The fix is a standard statistical recalibration that rescales the options signal to match its historical relationship with realized outcomes, which restores meaningful forecasting skill.
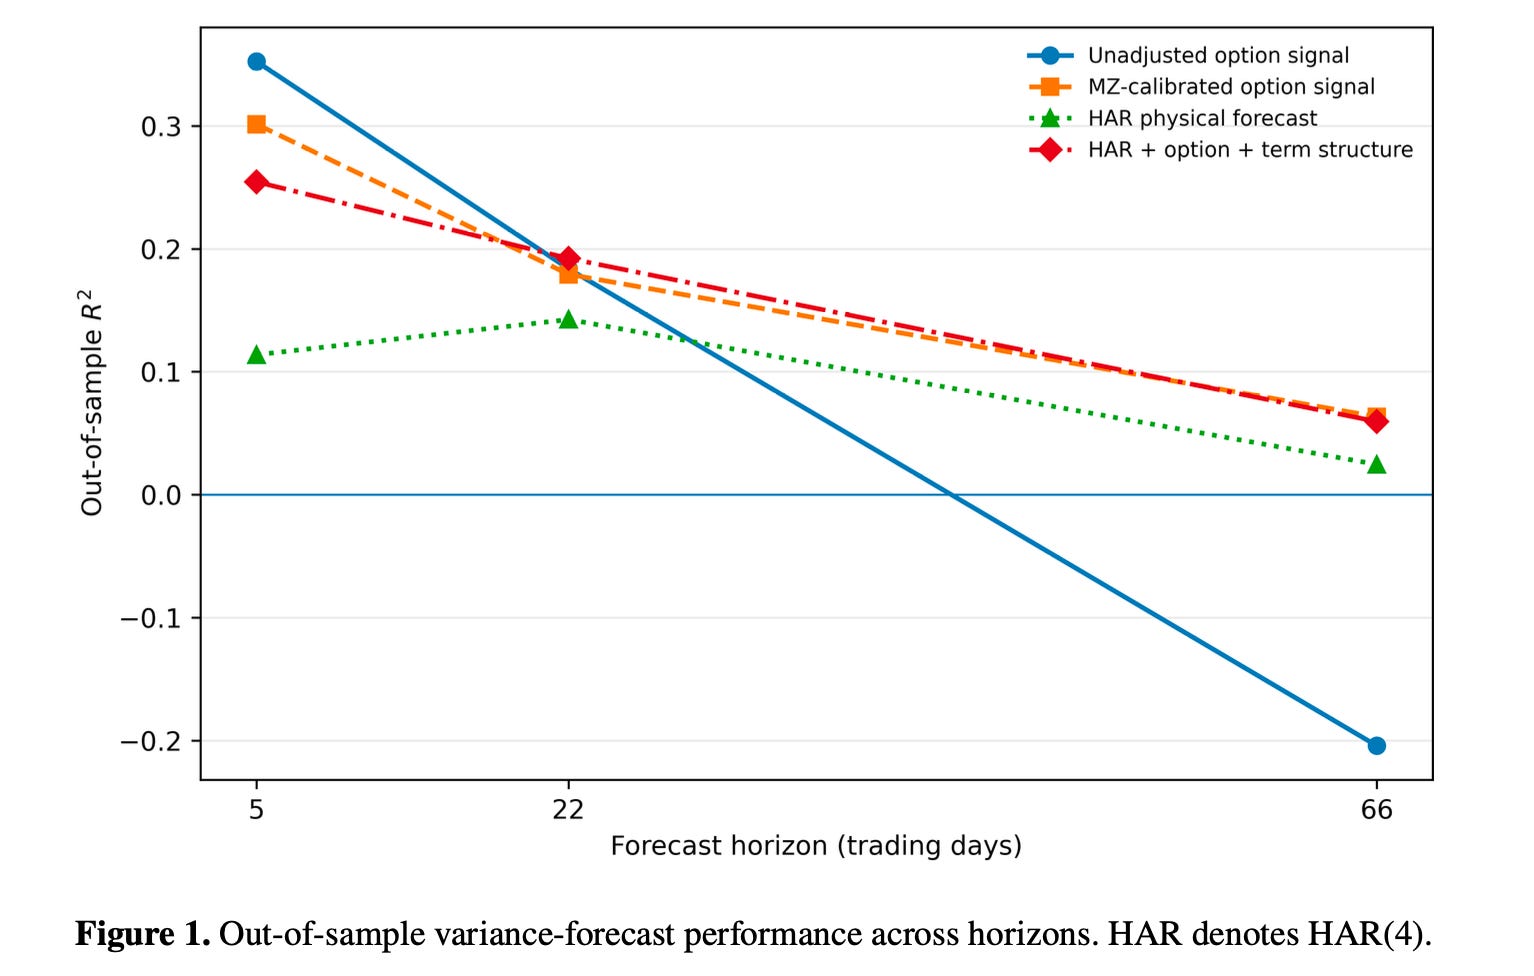
Even recalibrated, though, the options-based forecast doesn’t significantly beat a purely backward-looking model at this longer horizon, so its edge is really about fixing a scaling problem, not revealing hidden information. For a leveraged-ETF holder or risk manager, that’s the practical takeaway: the market’s implied volatility is a genuinely useful monthly gauge, but treating it as gospel for quarterly risk monitoring without adjustment can be actively misleading.
Goyle, Kartikay and Revtsov, Yevgen, When Does Option-Implied Variance Add to Physical Forecasts? Evidence from S&P 500 Leveraged ETF Drag (August 21, 2026). Available at SSRN: https://ssrn.com/abstract=7325618 or http://dx.doi.org/10.2139/ssrn.7325618
Your DCF Model Is Lying to You About Frontier Markets (Here's a Fix Built on Bayesian Priors and Currency Jumps)
A frontier-market investor doesn’t actually want one number, they want a map of everything that could plausibly happen to their investment, and this paper builds the machinery to draw that map.
This is less an empirical finding and more a proposed toolkit, which changes how we should treat it. The author’s argument is that standard discounted cash flow analysis quietly assumes a stable, well-behaved world (smooth currency moves, independent shocks, roughly normal outcomes) and that assumption simply breaks in frontier markets, where currencies sit still for years and then devalue all at once.
The fix combines three ingredients: a Bayesian approach that lets you blend thin historical data with expert judgment when estimating growth, a jump-diffusion model that treats currency crises as sudden, discrete events rather than smooth drift, and a Student-t copula that captures how FX shocks, inflation, and risk premiums tend to spike together rather than independently. Feed all of that into a Monte Carlo simulation and instead of one DCF number you get a full distribution of possible values, with an explicit downside case.
For investors, the appeal isn’t a better point estimate, it’s an honest accounting of tail risk that a textbook DCF simply ignores, or as the author puts it, uncertainty here should be “weaponized... into a competitive advantage.”
Chipili, Rackson, A Bayesian and Monte Carlo Framework for Equity Valuation in Frontier Markets (August 20, 2026). Available at SSRN: https://ssrn.com/abstract=7318419 or http://dx.doi.org/10.2139/ssrn.7318419
This week for paid subscribers
Paid subscribers are dissecting quarter-end funding pressure in repo markets, measuring dislocations in the 99th percentile versus the quoted SOFR median, and testing how bank reserve scarcity drives turn-date spreads. This post covers stripping ambient funding levels from turn windows, why the standard level measure yields a statistical null while tail dispersion more than doubles, and how the true 2019 peak hit in June rather than September. Python Code included.

Disclaimer: The content provided in this newsletter, “Alpha in Academia,” is for informational and educational purposes only. It should not be construed as financial advice, investment recommendations, or an offer or solicitation to buy or sell any securities or financial instruments. Past performance is not indicative of future results. The financial markets involve risks, and readers should conduct their own research and consult with qualified financial advisors before making any investment decisions.
The interpretations, opinions, and analyses presented herein are those of the author and do not necessarily reflect the views of the original researchers, their institutions, or the full implications of the cited academic papers. While every effort is made to accurately represent the research discussed, readers should be aware that the summaries and interpretations may not capture the full scope or nuances of the original studies. The information contained in this newsletter is believed to be accurate and reliable at the time of publication, but accuracy and completeness cannot be guaranteed. The author and publisher accept no liability for any loss or damage resulting from reliance on the information provided.
This newsletter may contain links to external websites or resources. The author is not responsible for the content, accuracy, or reliability of these external sources.
By subscribing to or reading this newsletter, you acknowledge that you have read and understood this disclaimer and agree to hold the author and publisher harmless from any liability that may arise from your use of the information contained herein.