

Welcome back to another issue of Recent Academic Research!
Let’s get into it.
The Hidden Cost of One-Period Thinking in Tactical Allocation
Institutional investors who re-optimize tactical bets one period at a time are quietly leaving roughly half of their achievable alpha on the table.
Kolm and Ritter tackle a governance habit that almost every large allocator follows: set the strategic policy, then let the tactical team re-solve a single-period problem each rebalance. That workflow looks disciplined, but it ignores a simple fact. Today’s trade becomes tomorrow’s inherited position, and the cost of moving it around is real. The authors show that the fully dynamic solution splits a question the one-period rule blurs together, namely where the portfolio should go versus how quickly it should get there. Signal persistence turns out to be the pivot. Below a specific threshold, short-lived alphas should be sized down relative to conventional tactical allocation (the trade lingers after the edge has faded), and above it, persistent views deserve larger positions than the standard rule prescribes.
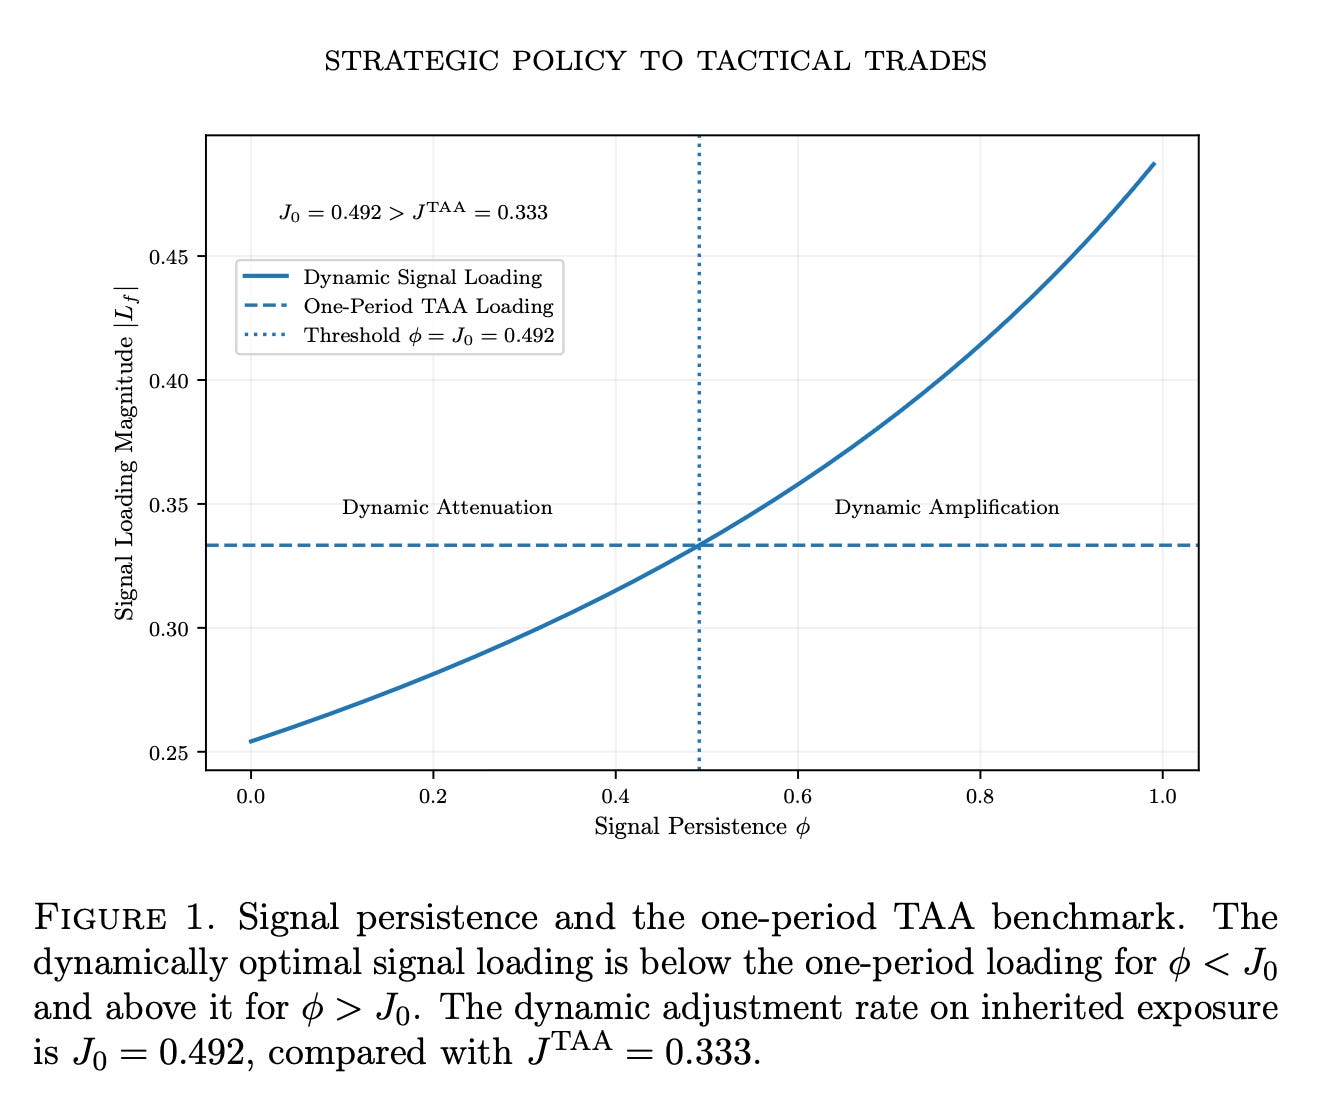
Even more striking, in their three-asset example, a governance-compatible reformulation recovers about half of the value that repeated one-period optimization destroys, without dismantling the strategic/tactical split. For investors, the message is practical: the machinery you already use can be recalibrated to capture most of the benefit of a full dynamic model, and the usual instinct to match a “smarter” model coefficient-by-coefficient is the wrong yardstick, because economic value and coefficient proximity are not the same thing.
Kolm, Petter N. and Ritter, Gordon, From Strategic Policy to Tactical Trades: Dynamic Asset Allocation with Predictable Returns and Trading Costs (August 31, 2026). Available at SSRN: https://ssrn.com/abstract=7384838 or http://dx.doi.org/10.2139/ssrn.7384838
The Fed's 98% Talk: How Words Move Markets More Than Actions
The Fed’s most powerful tool isn’t rate changes, it’s the carefully worded hints about what might come next.
Cieslak, Hansen, and Pang dig through 43 years of FOMC transcripts (365 meetings from 1976 to 2019) to show that the Fed’s policy “tilt,” the forward-looking signal about where rates might head, functions as a distinct policy tool separate from the actual rate decision. Over half (51%) of policy statements in meetings are future-oriented rather than about the current move, and these tilts consistently predict rate changes up to a year ahead, even after controlling for the Fed’s own economic forecasts. The mechanism driving tilts is risk management: policymakers lean hawkish or dovish based on which mistake would be costlier to reverse, not just what they expect to happen.
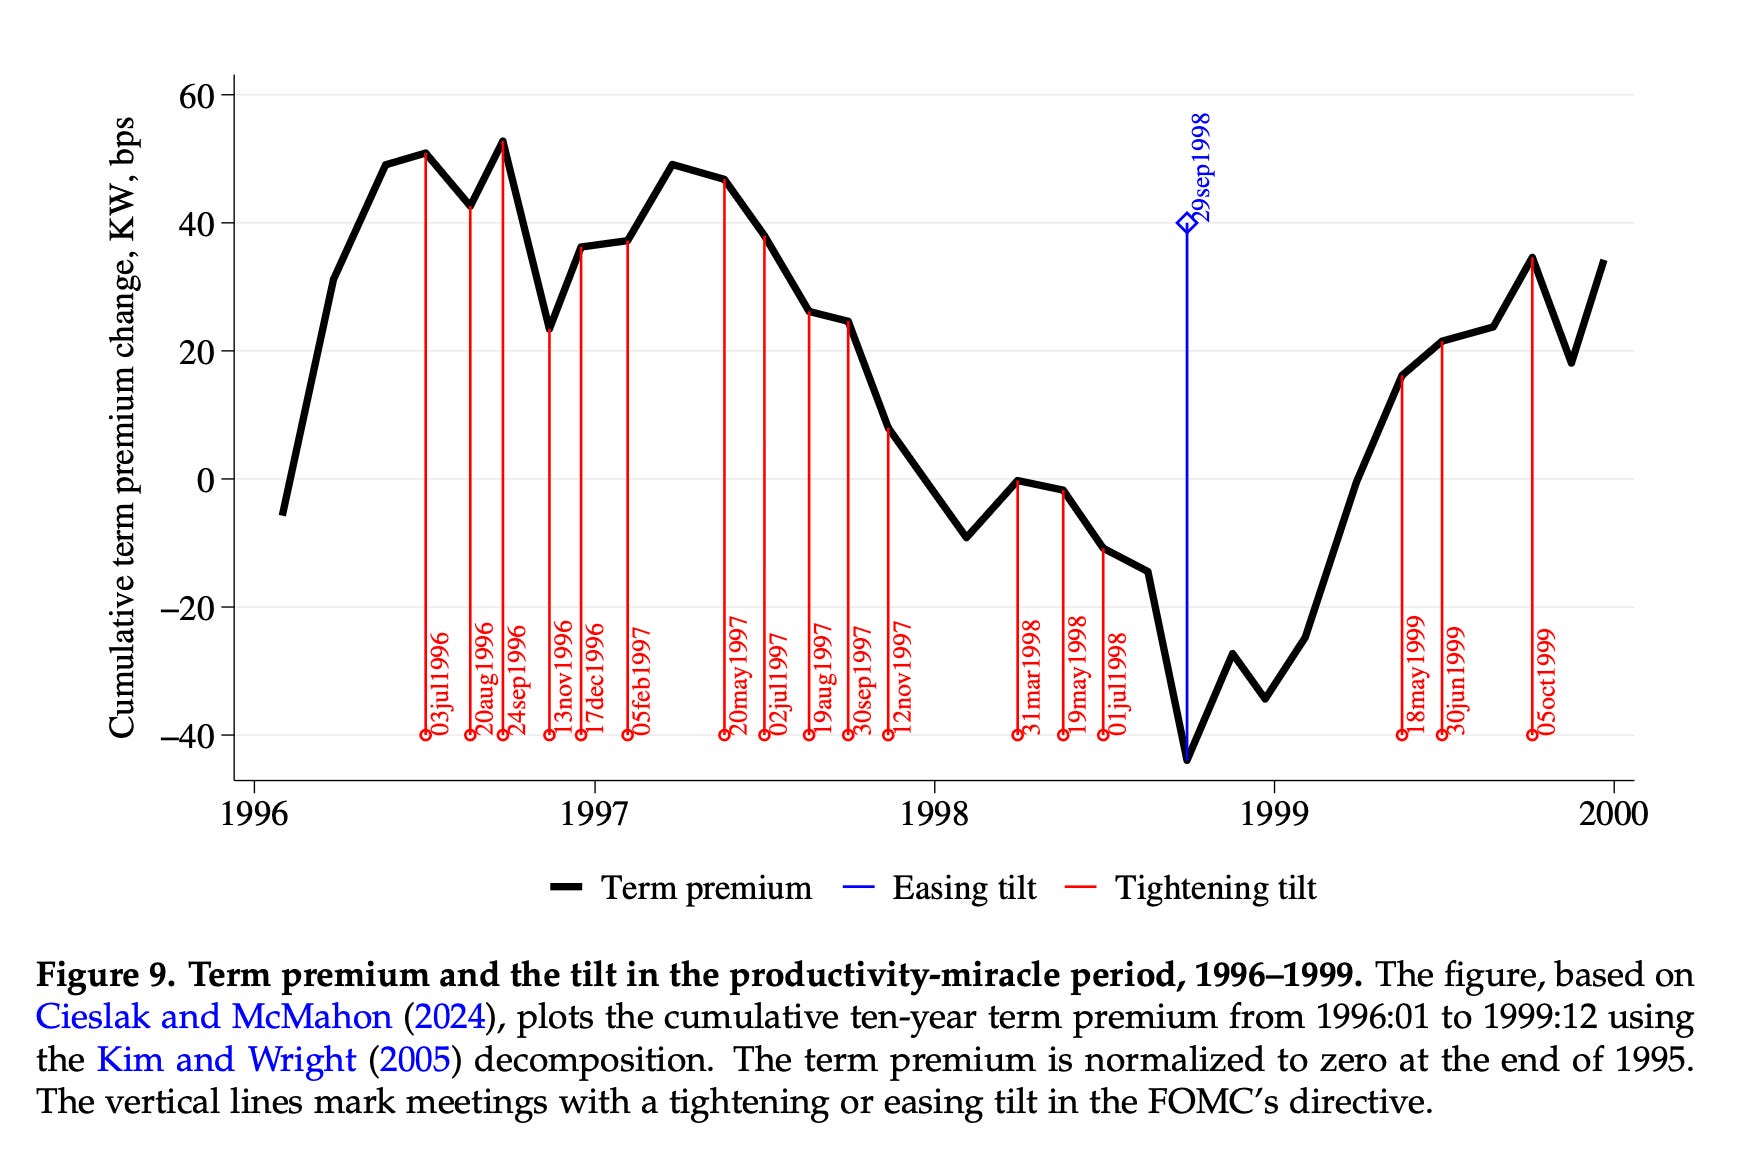
The market impact is real and measurable. Hawkish tilts compressed the ten-year term premium by roughly 90 basis points from 1996 to 1998 while the funds rate barely moved, and the 2020 framework’s retreat from preemptive language coincided with the largest term-premium spike since 1994. For investors, this means parsing FOMC language (not just decisions) is essential for anticipating where long rates and risk premiums are heading.
Cieslak, Anna and Hansen, Stephen and Pang, Hao, Risk Management in Monetary Policy: A Review with Asset Pricing Implications (August 25, 2026). Available at SSRN: https://ssrn.com/abstract=7350618 or http://dx.doi.org/10.2139/ssrn.7350618
Your Factor Model Is Reading Yesterday's Newspaper
Fama-French factors are built on financial statements that are, on average, almost a year old, and fixing that staleness quietly rewrites thousands of alphas.
Bowles, Reed, Ringgenberg, and Thornock point out something hiding in plain sight: standard Fama-French factors reassign firms to portfolios only once a year, every June, using financial statements that are already months old. Rebuild the portfolios monthly using each firm’s most recent annual filing, and the average age of the underlying information drops from roughly 347 days to 203 days. HML (value) and CMA (investment) change the most because their inputs move fastest.
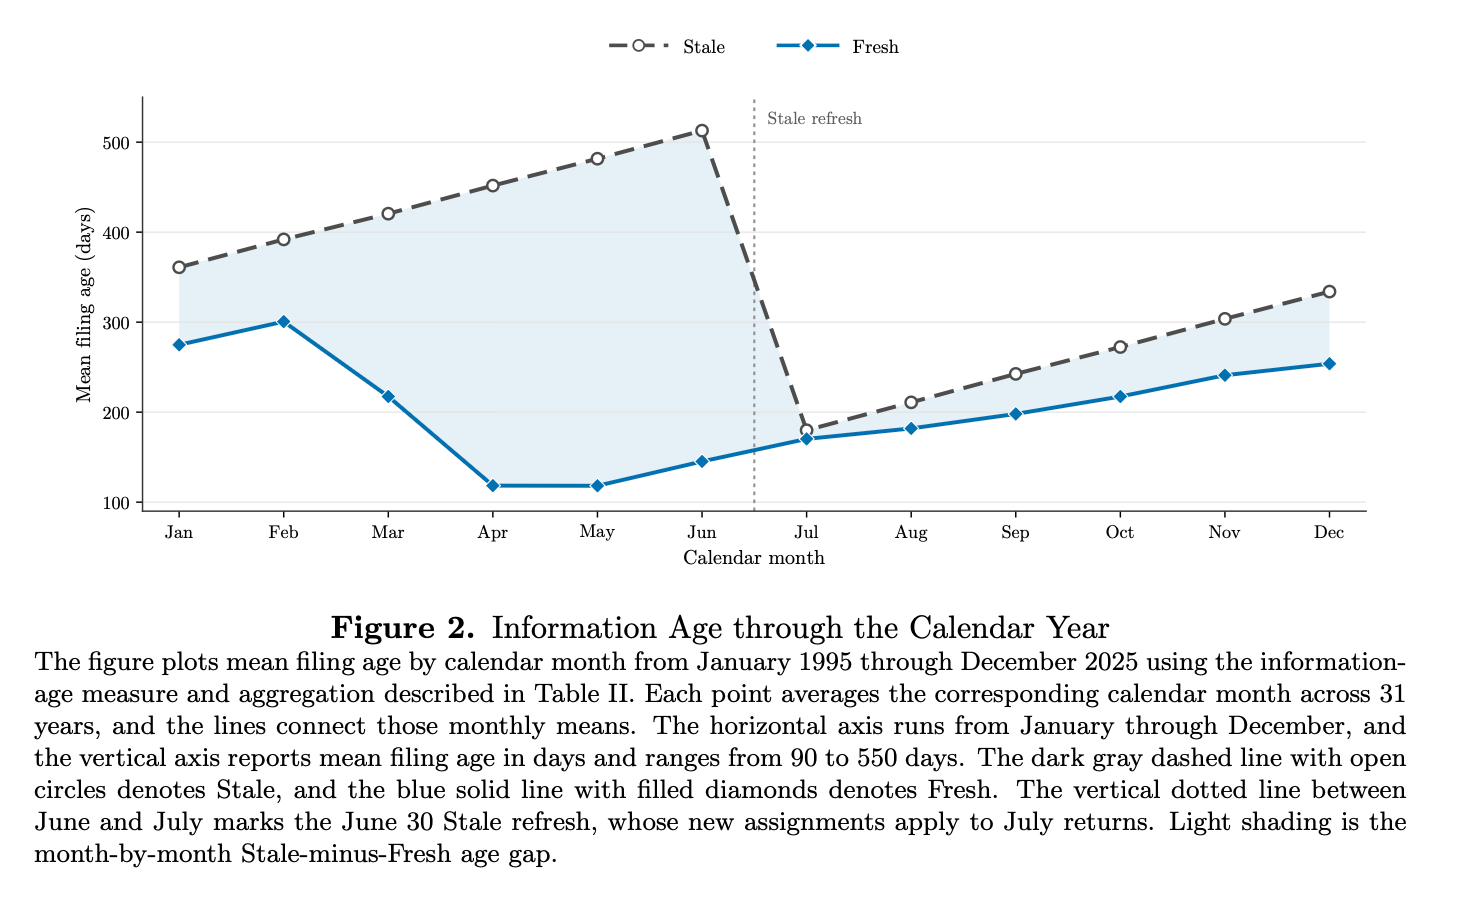
The interesting twist is that swapping fresh factors for stale ones does not clearly improve asset pricing. What does work is treating the “update return” (the difference between fresh and stale) as its own separate factor, because assets load on the slow-moving fundamental component and the fast-moving information component in different ways. The practical stakes are real: benchmark choice flips the sign of nearly 1,800 earnings-announcement CARs and reshuffles roughly 15% of top-decile mutual funds, meaning which managers look skilled depends partly on when you refresh the ruler.
Bowles, Boone and Reed, Adam V. and Ringgenberg, Matthew C. and Thornock, Jacob, Factor Time (August 31, 2026). Available at SSRN: https://ssrn.com/abstract=7384719 or http://dx.doi.org/10.2139/ssrn.7384719
Momentum on ETFs Doesn't Work. The Rules Around It Do.
The alpha in ETF momentum isn’t in the signal, it’s in the boring operational rules wrapped around it.
Across 3,215 U.S. ETFs and 25 years of weekly data, textbook momentum applied to ETFs is a disaster. The four standard lookbacks (1, 3, 6, and 12 months) deliver Sharpe ratios ranging from slightly positive to negative, with drawdowns between 69% and 82%, worse than simply holding SPY. What makes this paper interesting is what happens when the authors bolt on three unglamorous layers that any disciplined retail investor could implement: a technical filter to confirm the trend is real, mandatory diversification across asset-class buckets so you don’t accidentally hold three S&P 500 funds at once, and a 7% trailing stop on every position.
The same universe, same costs, same momentum ranking, now produces a Sharpe above 1.3 and a maximum drawdown of just 7%. Notably, the extra return isn’t the story; the strategy barely beats equities on absolute return. What it does is slash tail risk by roughly forty percentage points of drawdown. The one place it still breaks is when VIX pushes above 25, because diversification stops working when correlations converge. For investors, the reframe is uncomfortable but useful: stop hunting for the perfect signal and start auditing your exit discipline.
Magner, Nicolás and Sanhueza, Aliro Joel, Momentum Strategies in ETFs under Simple Operational Rules: Economic Value and Conditional Predictability. Available at SSRN: https://ssrn.com/abstract=7379989 or http://dx.doi.org/10.2139/ssrn.7379989
A Dollar Is a Dollar, Until You Read the Fine Print
Once households learn the institutional differences between digital currencies, they demand a much larger interest premium to hold stablecoins than tokenized bank deposits, and both more than a CBDC.
Castagnetti, Cillo, Gurrado, and Masciandaro ran a randomized experiment with 800 participants in France, Germany, and Italy to test whether people actually distinguish between the three main flavors of digital money: central bank digital currencies (CBDCs), tokenized commercial bank deposits, and non-bank stablecoins. Baseline beliefs treated all three as roughly interchangeable, which matches the “money is money” intuition most consumers carry around. But a short informational nudge about how each issuer is (or isn’t) backstopped produced sharply asymmetric updates: perceived default risk fell for CBDCs, stayed flat for commercial banks, and rose for non-bank issuers.
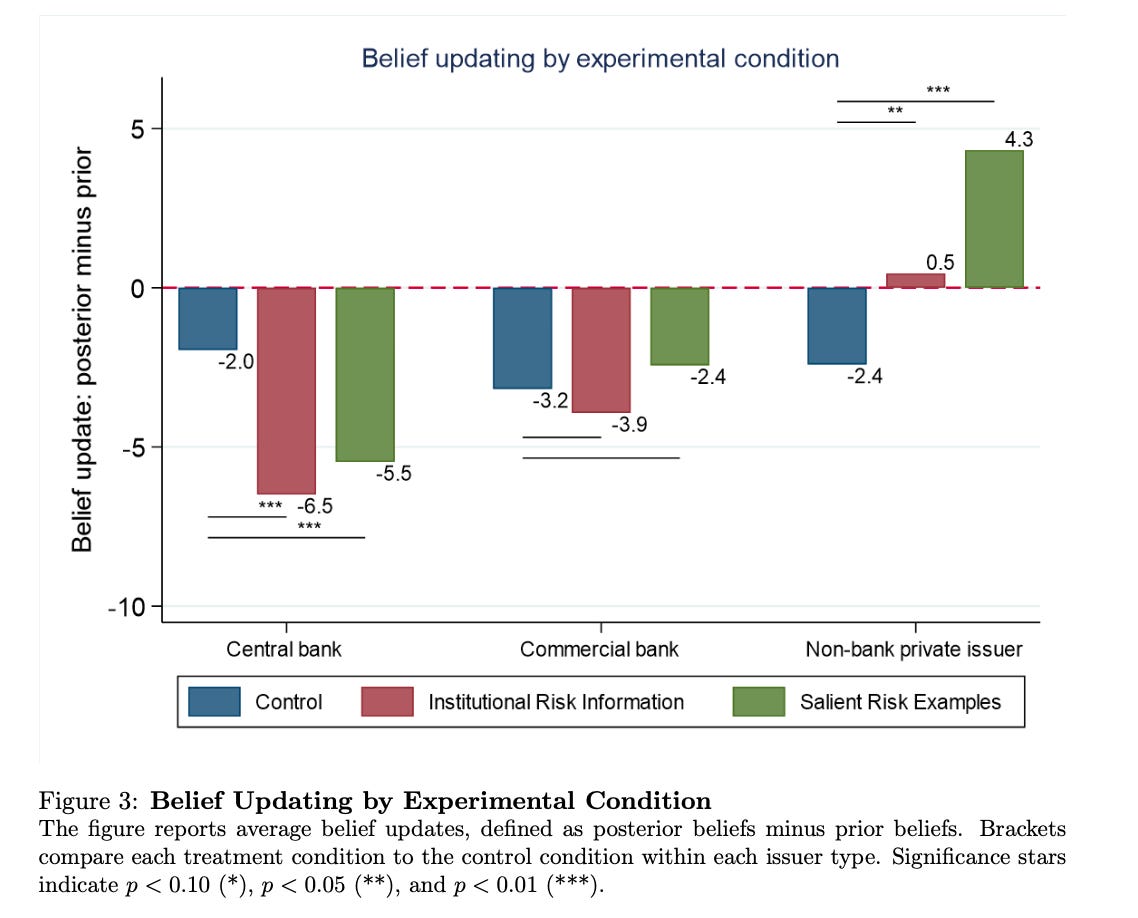
When the researchers translated choices into a structural model, informed participants demanded meaningfully higher interest to hold commercial-bank digital money over a CBDC, and a premium roughly three times larger to hold stablecoins over commercial-bank money. For markets, this suggests stablecoin yields may need to rise materially as retail financial literacy improves, and that CBDCs enjoy a real (not just rhetorical) trust advantage once institutional differences become salient.
Castagnetti, Alessandro and Cillo, Alessandra and Gurrado, Giuseppe and Masciandaro, Donato, Digital Money, Default Risk, and Financial Information: An Experiment on Europe (September 01, 2026). BAFFI Centre Research Paper No. 284, Available at SSRN: https://ssrn.com/abstract=7395438 or http://dx.doi.org/10.2139/ssrn.7395438
This week for paid subscribers
Paid subscribers are getting a look at why the H100 rental curve quit pricing obsolescence at the end of 2025 while the A100 curve never moved, and what that structural divergence reveals ahead of CME’s new compute futures launch on October 5. This post isolates chip-specific demand from general compute duration repricing, documents how H100’s 36-to-12-month term slope collapsed from -23% backwardation to flat across late 2025, and details the benchmark governance risks and data artifacts behind Silicon Data’s index. Python notebook and data included.

Disclaimer: The content provided in this newsletter, “Alpha in Academia,” is for informational and educational purposes only. It should not be construed as financial advice, investment recommendations, or an offer or solicitation to buy or sell any securities or financial instruments. Past performance is not indicative of future results. The financial markets involve risks, and readers should conduct their own research and consult with qualified financial advisors before making any investment decisions.
The interpretations, opinions, and analyses presented herein are those of the author and do not necessarily reflect the views of the original researchers, their institutions, or the full implications of the cited academic papers. While every effort is made to accurately represent the research discussed, readers should be aware that the summaries and interpretations may not capture the full scope or nuances of the original studies. The information contained in this newsletter is believed to be accurate and reliable at the time of publication, but accuracy and completeness cannot be guaranteed. The author and publisher accept no liability for any loss or damage resulting from reliance on the information provided.
This newsletter may contain links to external websites or resources. The author is not responsible for the content, accuracy, or reliability of these external sources.
By subscribing to or reading this newsletter, you acknowledge that you have read and understood this disclaimer and agree to hold the author and publisher harmless from any liability that may arise from your use of the information contained herein.