Hello and welcome back to another paid post!
On October 5, 2026, CME will list two cash-settled compute futures on NYMEX, one on Silicon Data’s H100 rental index and one on the B200. Each contract represents a month of rent. Before they list, I wanted to know what the existing term structure for GPU rentals looks like, and whether it has been stable.
Silicon Data’s H100 term curve was backwardated by roughly 23% from twelve months to thirty-six months in April 2025, meaning long-dated compute was much cheaper than near-dated. By March 2026 that gap had closed entirely. The A100 curve, built by the same vendor using the same methodology, did not move. It hovered near -10% throughout and ended the sample at -8.7%. This change belongs to Hopper and was not a general repricing of compute.
Let's dive right in.
What is a Compute Future?
The thing being priced is rent on a graphics card. If you want to train or serve a model and don’t own hardware, you rent H100s by the hour from a cloud provider, and that hourly rate is the price. Silicon Data collects those rates across providers and publishes a daily index, in the same way that Platts publishes an assessed price for a crude grade nobody trades on a screen.
A futures contract on that index works like any other cash-settled future. Nobody delivers a GPU. Two parties agree on a price today for a contract that will settle against the published index over some future month, and whoever was on the right side collects the difference. CME’s two contracts each represent a month’s worth of rent on one card, one referencing the H100 index and one the B200. The final settlement mechanics are in CME’s contract notice and the exact averaging convention will matter for anyone trading them.
The reason to want this is straightforward on both sides. If you’re a startup whose costs are dominated by inference spend, your exposure to GPU rental rates is real and currently unhedgeable except by signing long reserved contracts, which locks up capital and commits you to a specific chip. If you’re a neocloud that has borrowed against a fleet you’re renting out at spot, you have the opposite exposure and no way to lock in revenue. Futures let both sides move that risk without touching the physical machines. Whether enough of them show up to make a liquid market is the open question, and October 5 is only the start of the answer.
How Compute is Different
A commodity forward curve usually has an anchor. If you can buy oil today, store it, and sell it forward, then the forward price cannot exceed spot plus storage and financing without someone taking the free money. Cash-and-carry pins the curve to physical reality.
Compute has no such anchor. You cannot store an idle GPU-hour and sell it in March. This puts compute in the same bucket as electricity, but with a complication power doesn’t have. Electricity’s generating fleet depreciates slowly and predictably. A GPU’s economic life is governed by when its successor ships, and the successor ships on a roughly annual cadence that everyone can see coming.
So the compute forward curve is doing something specific: pricing the expected obsolescence of a machine against the expected growth in demand for what it does. When obsolescence dominates, the curve slopes down. When scarcity dominates, it doesn’t. That ratio is not a fixed property of the asset, and the interesting question is whether it moves.
Data and Methodology
Silicon Data publishes a daily forward curve for H100, A100, and B200 out to thirty-six months, in two forms. The term rate is today’s locked-in price for a rental ending at a given tenor, built from observed contracts at standard lengths. The forward rate is the implied price of a short rental beginning at that tenor, derived from the term curve by differencing.
I pulled the numbers from Silicon Data’s portal: set the date, read the table, move on. That constrains me to the tenors the portal displays, which are twelve, twenty-four, and thirty-six months.
I sampled in two passes. The first walked the second of each month from January 2025 to September 2026. That pass put a sign change somewhere between the December and January snapshots, so a second pass filled in weekly observations through November and December 2025. The uneven spacing is a direct consequence of that order.
Two construction artifacts turned up in validation and both are worth naming. On January 2, 2025, every tenor carries an identical value on both rate types. Through March 2025 the twenty-four and thirty-six month points are identical, which means the long end was extrapolated flat rather than built from observed contracts at those lengths. Neither is a market observation. The usable sample starts in April 2025 and runs to September 2026, twenty-five as-of dates for H100. Throughout, I summarize curve shape as the thirty-six month rate divided by the twelve month rate, minus one. Negative is backwardation.
Results
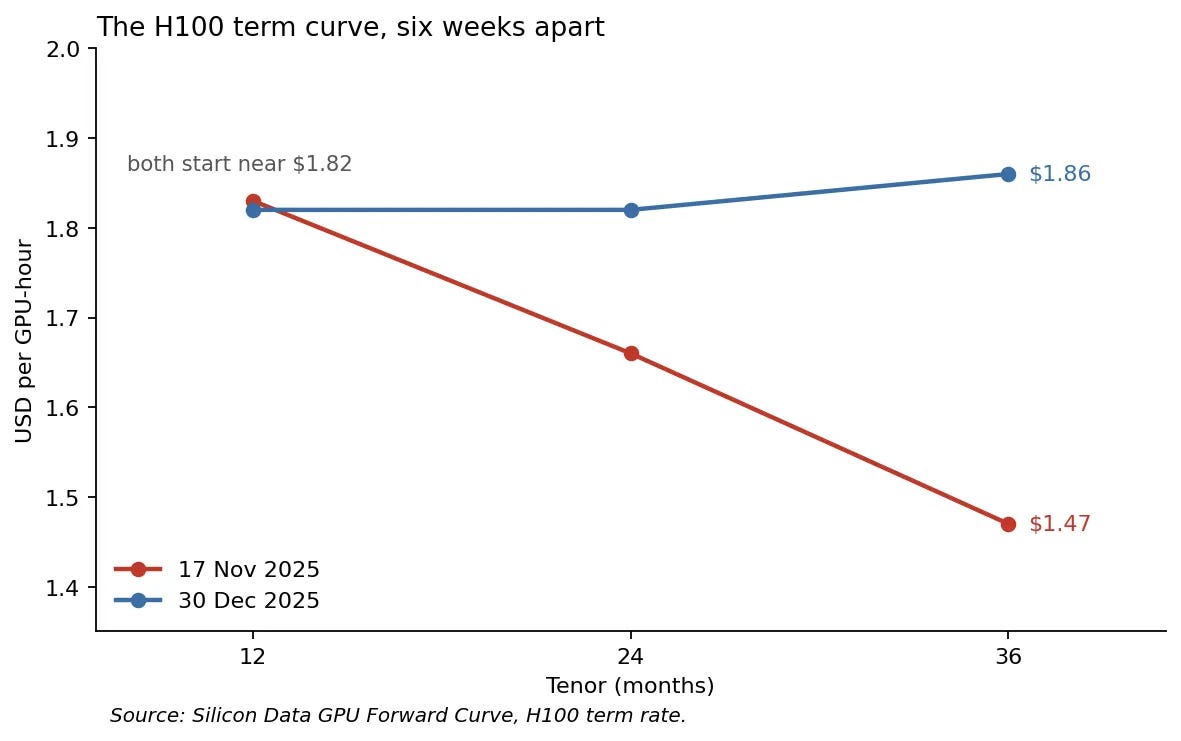
Start with the shape of the curve itself, six weeks apart.
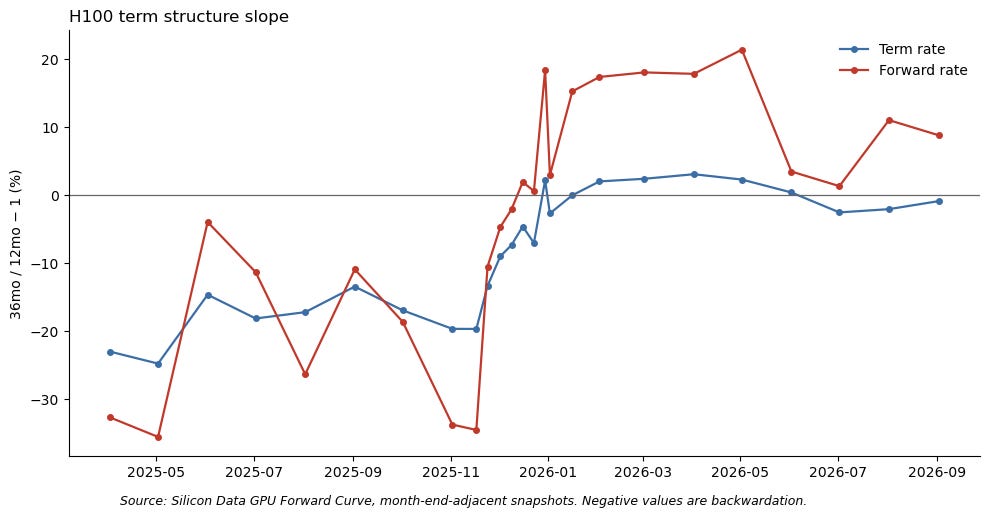
Here is the H100 term slope at monthly resolution, with the December weeks filled in.
On November 17, the term curve fell from $1.83 at twelve months to $1.47 at thirty-six. Six weeks later, on December 30, it rose slightly, $1.82 to $1.86. The forward curve made the same move harder, from $1.65 down to $1.08 in November and from $1.63 up to $1.93 by the end of December.
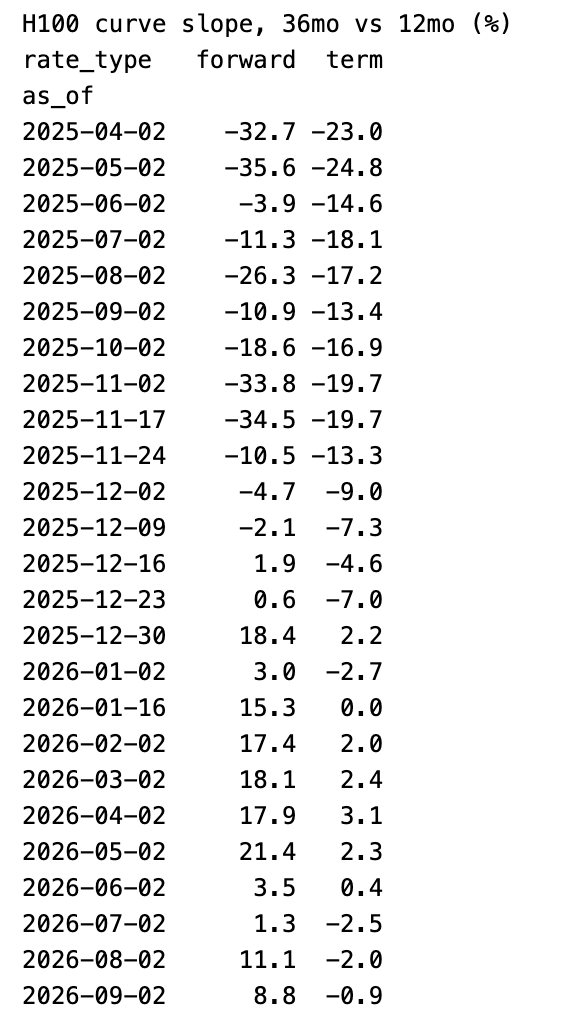
A regression of the term slope on time across the whole usable sample gives 19.6 percentage points a year, R² of 0.66, p below 0.00001. Splitting at December 15, the pre-period mean is −16.4% with a standard deviation of 5.2, and the post-period mean is −0.6% with a standard deviation of 3.1. The two ranges do not overlap, though only just: the highest pre-period reading is −7.3% and the lowest post-period reading is −7.0%.
The first column of the table is substantially less reliable than the second. The forward rate is produced by differencing the term curve, which amplifies whatever moves underneath. It shifts 13.3 percentage points between consecutive observations on average during 2025, against 3.6 for the term rate. It ranged from −3.9% to −35.6% within 2025 alone. The −3.9% reading on June 2, 2025 is barely more negative than the +0.6% on December 23 that sits after the supposed change. The forward curve moves in the same direction and further, and I would not quote its crossing date as if it meant anything precise. So the claim I’m willing to defend is about the term curve, where a −16% mean becomes roughly flat and stays there for nine months.