

Welcome back to another issue of Recent Academic Research!
Let’s get into it.
The Pre-BOJ Drift
Japanese stocks do almost all of their work in the days before a Bank of Japan meeting, and none of it after.
Maeda runs the Lucca and Moench pre-FOMC test on Nikkei 225 and TOPIX data from 2009 to 2026, and Tokyo behaves the same way. Buying at the close three sessions before a scheduled policy meeting and selling on the morning of the decision earned about half a percent per meeting, and those windows, roughly one trading day in eight, produced nearly half the cumulative index return.
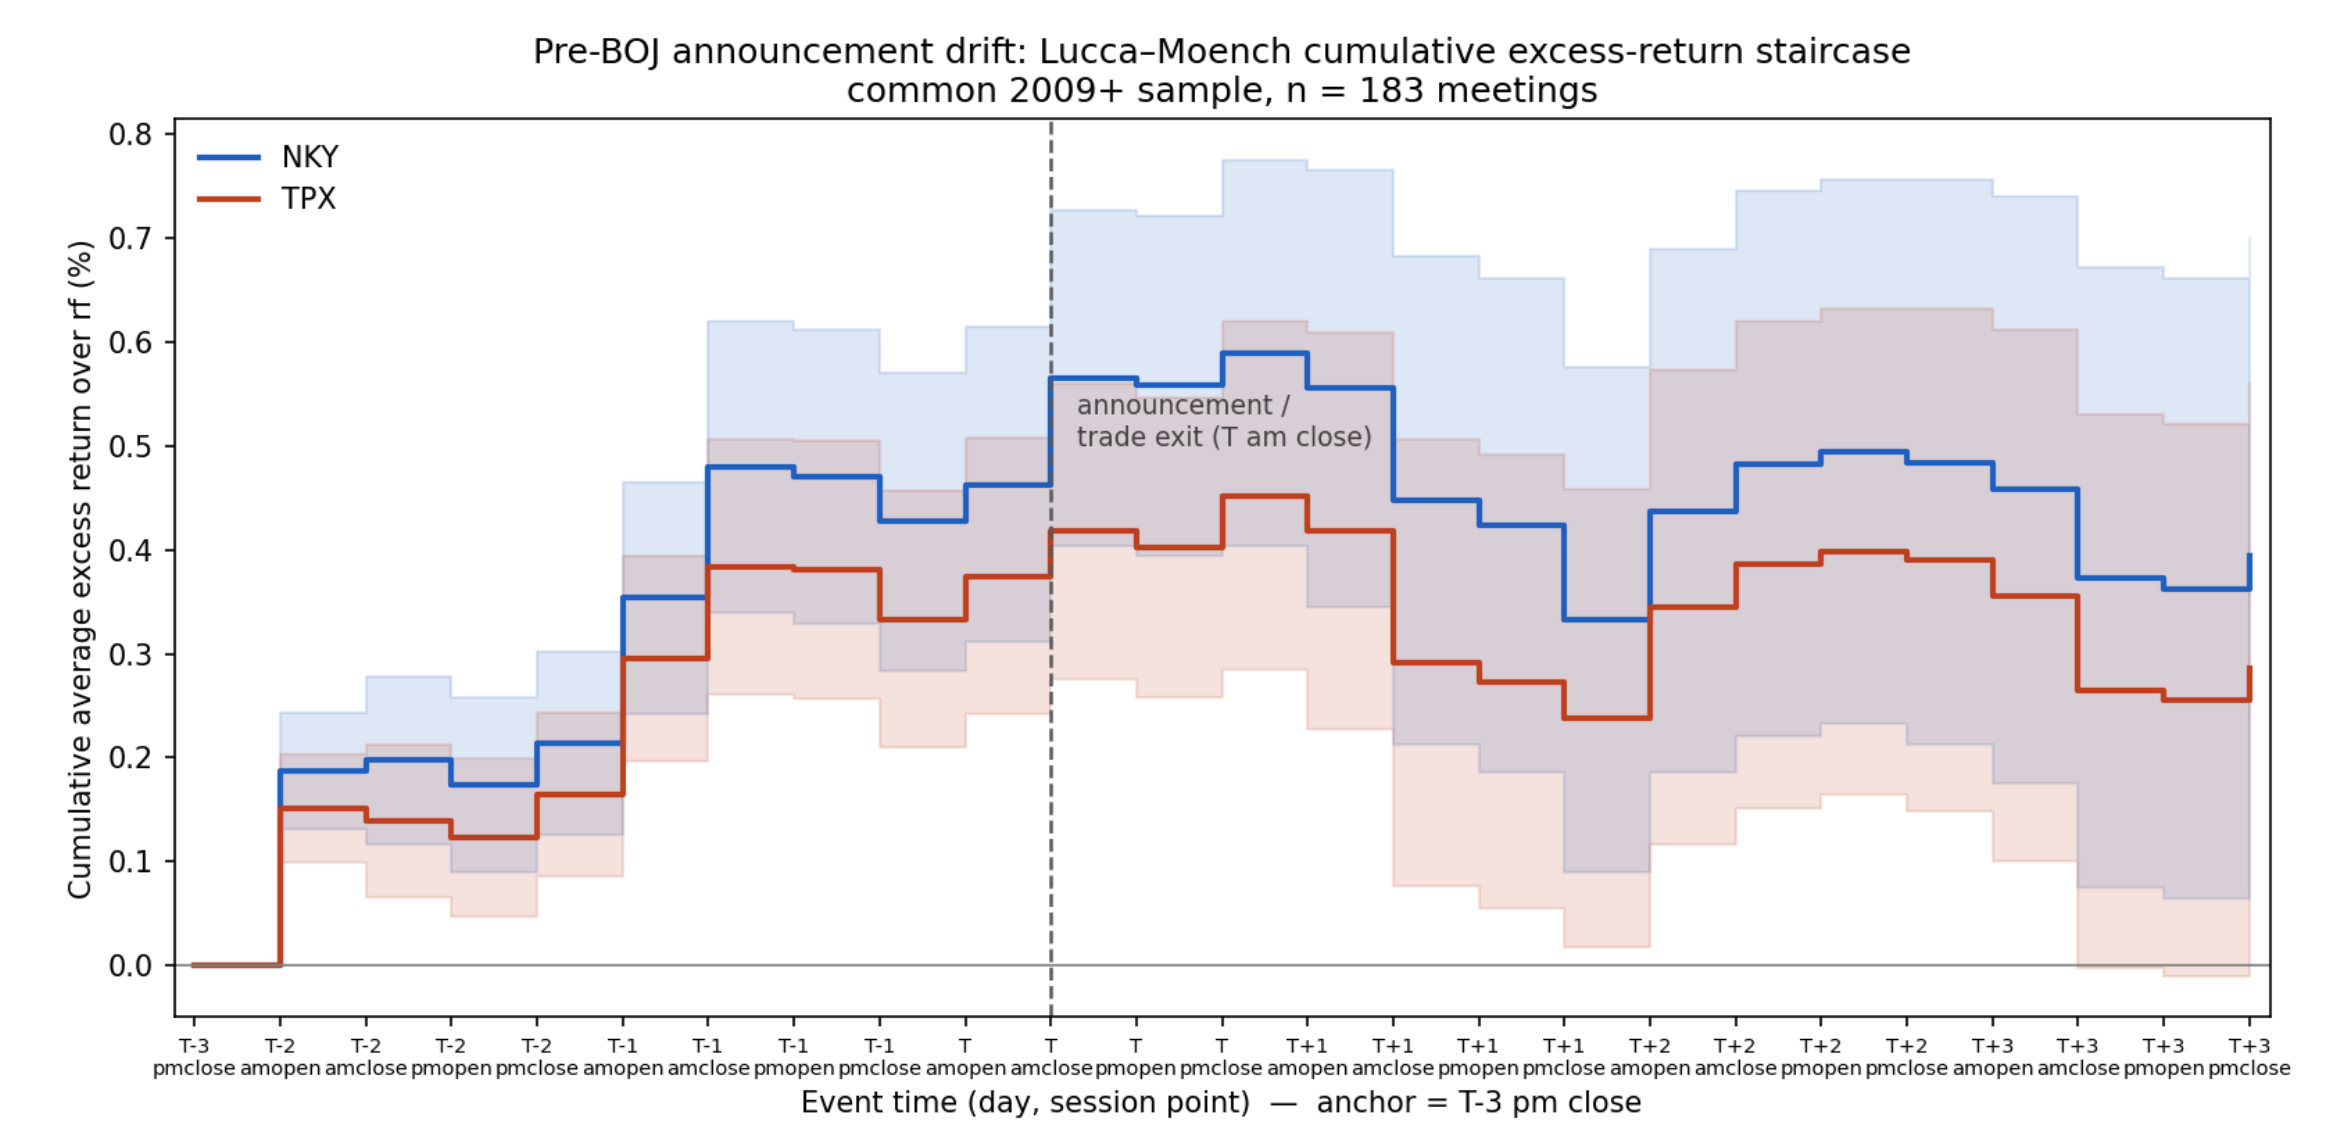
Figure 1: Cumulative return on the Nikkei 225 and TOPIX in the days around a BOJ decision, anchored three sessions before the meeting. The line climbs into the announcement (dashed) and goes flat afterward. Shaded bands are one standard error.
Volatility inside them was also not higher than on ordinary days, and the gain stops the instant the decision lands. What separates a large drift from none at all is fear going in. When the Nikkei volatility index is elevated three days out, the run up is big. And when markets are calm, it vanishes. The same pattern shows up in the yen but not in JGBs, so this looks like payment for holding risky assets into an uncertain event rather than anything about interest rates. The practical point is that a large share of Japanese equity return arrives on a schedule anyone can read off the BOJ calendar, and Maeda argues the effect is “a general feature of equity markets rather than a U.S.-specific anomaly.”
Maeda, Jun, The Pre-BOJ Announcement Drift: Evidence from Japanese Equity Indices (August 26, 2026). Available at SSRN: https://ssrn.com/abstract=7356758 or http://dx.doi.org/10.2139/ssrn.7356758
Only the Tail Survives
The oldest crash trade in the book mostly does not work, and most of its apparent edge is an artifact of counting the same bad day many times.
Large declines do not arrive independently. They land on the same handful of calendar dates, because whatever knocks one index down knocks everything else down that same afternoon. An event study that treats each stock day as a separate observation is counting one shock over and over, and the evidence looks decisive when it should not. Count each date once and it falls apart. In Dashyan’s panel of single names, a t statistic of 6.76 drops to 1.68.
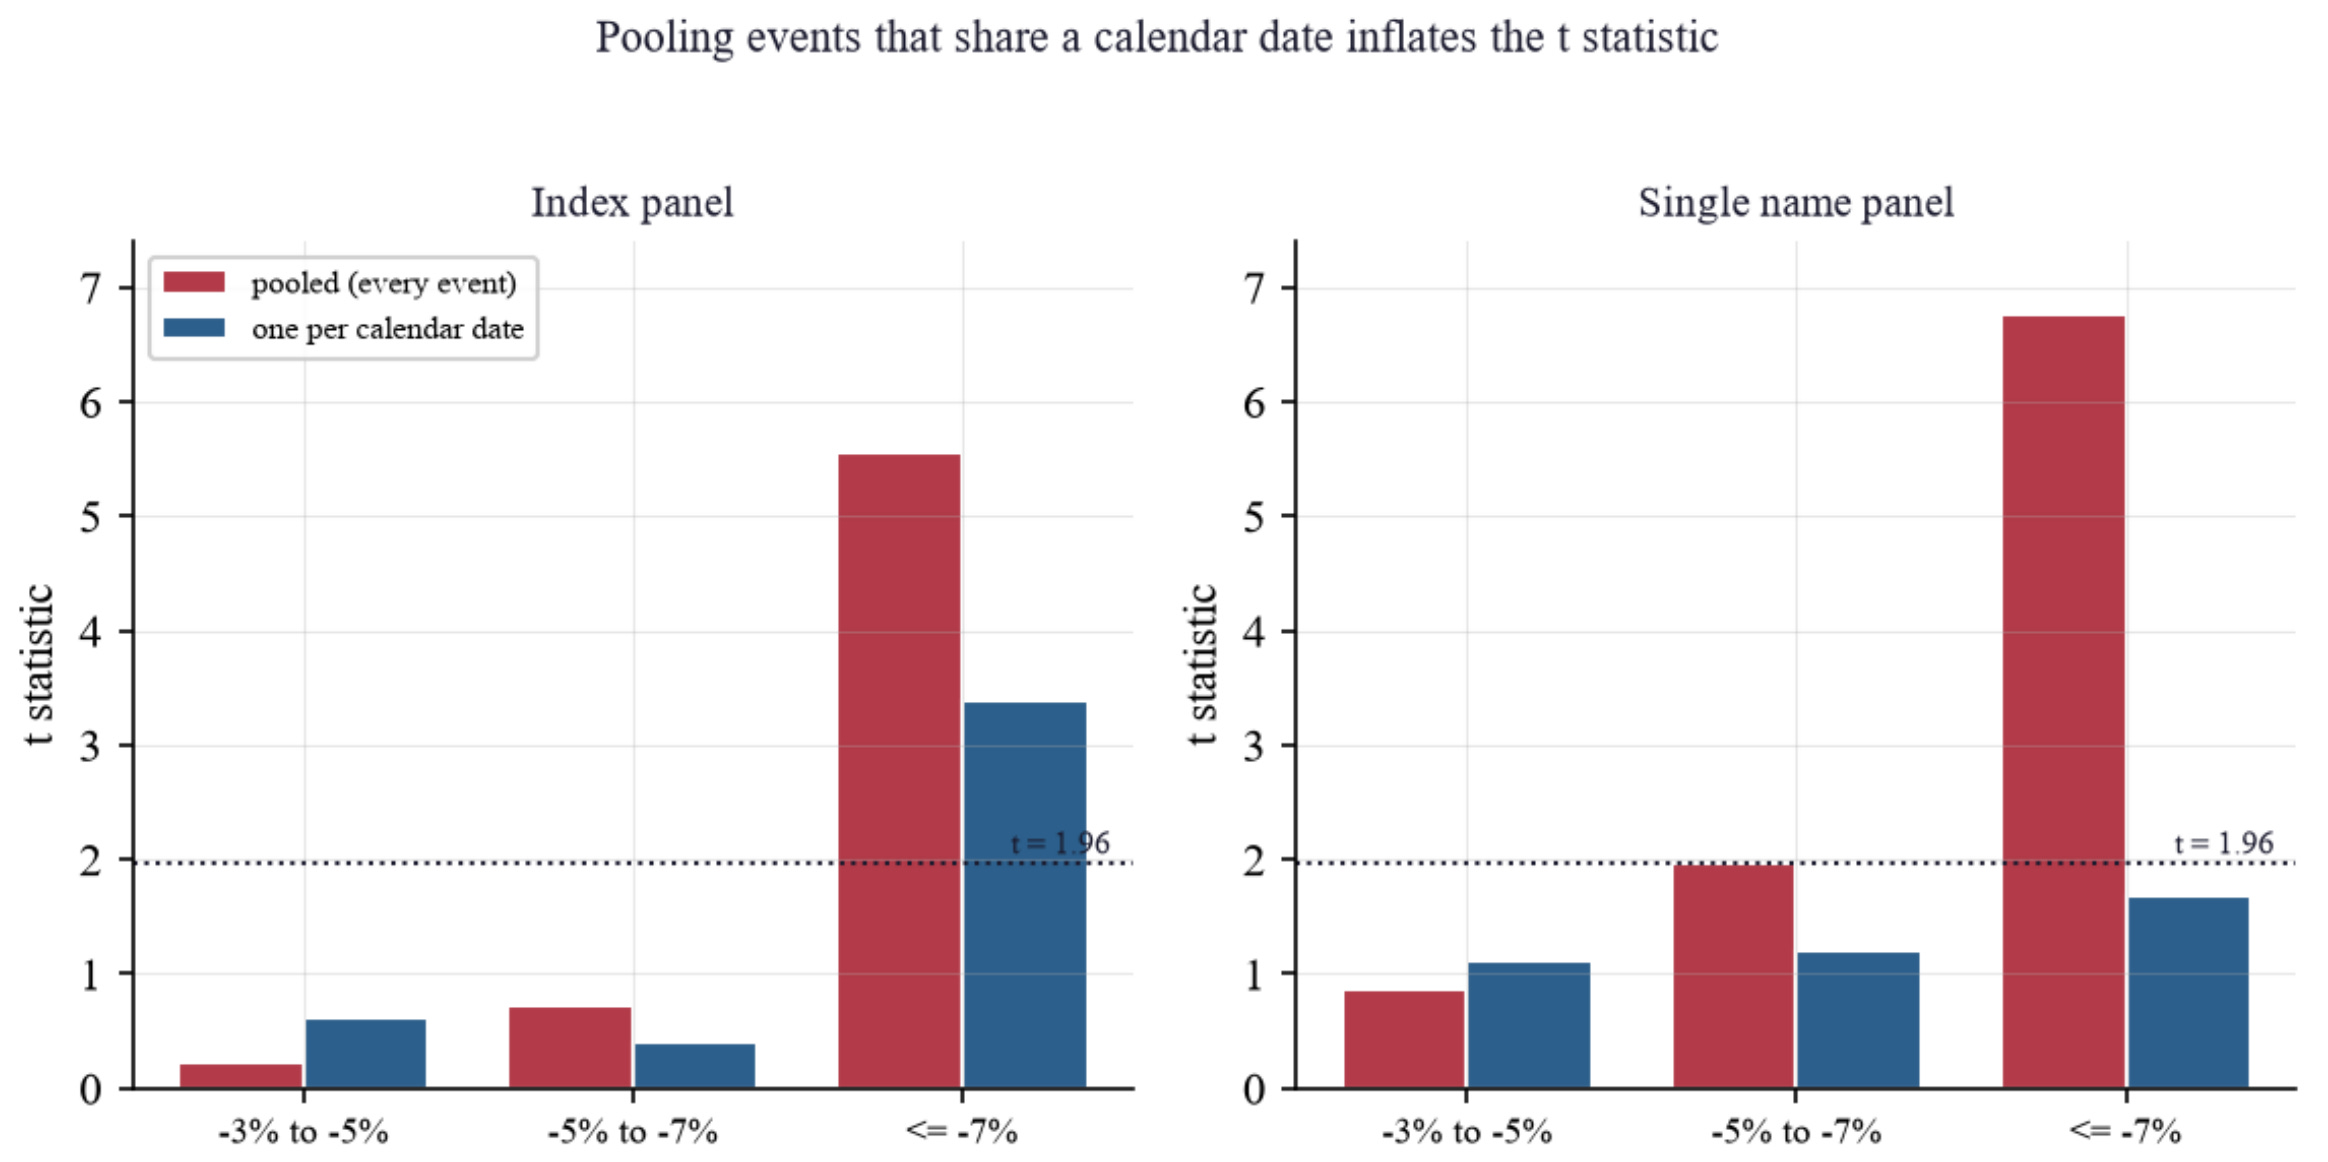
Figure 2: Same events, two ways of counting. Treating each stock's bad day as its own observation puts the evidence far above the significance line. Counting each calendar date once drops it below. The single name panel (right) is where the illusion is largest, since 28 stocks can crash on the same afternoon.
Correct three other counting problems and exactly one result survives out of everything tested across US indices, individual stocks, and crypto perpetual futures. Index drops of seven percent or worse are followed by a strong next session, and most of that move happens after the open, so a real participant could capture it.
The catch is frequency. The signal has fired 25 times in 76 years and beats Treasury bills by less than half a point a year. For investors the transportable lesson is about evidence rather than crashes, since it is “a good idea that mostly does not work,” and plenty of published backtests look strong for exactly this reason.
Dashyan, Alexandr, The Tail Is the Only Signal: Flush Reversion in Equity Indices and Crypto Perpetual Futures (July 01, 2026). Available at SSRN: https://ssrn.com/abstract=7363482 or http://dx.doi.org/10.2139/ssrn.7363482
The Investment Grade Fire Sale
When bond ETFs were forced to sell during the COVID crash, the price damage landed on safe investment grade bonds, not on junk.
The intuition says forced selling hurts the least liquid assets first, so high yield should have cracked. Spoiler, it didn't. The authors tracked daily holdings for 135 corporate bond ETFs and find that bonds caught in ETF fire sales lost about 3 basis points of benchmark adjusted return in normal times, and roughly 15 more during the four weeks ending March 20, 2020. Almost all of that extra damage sits in investment grade.
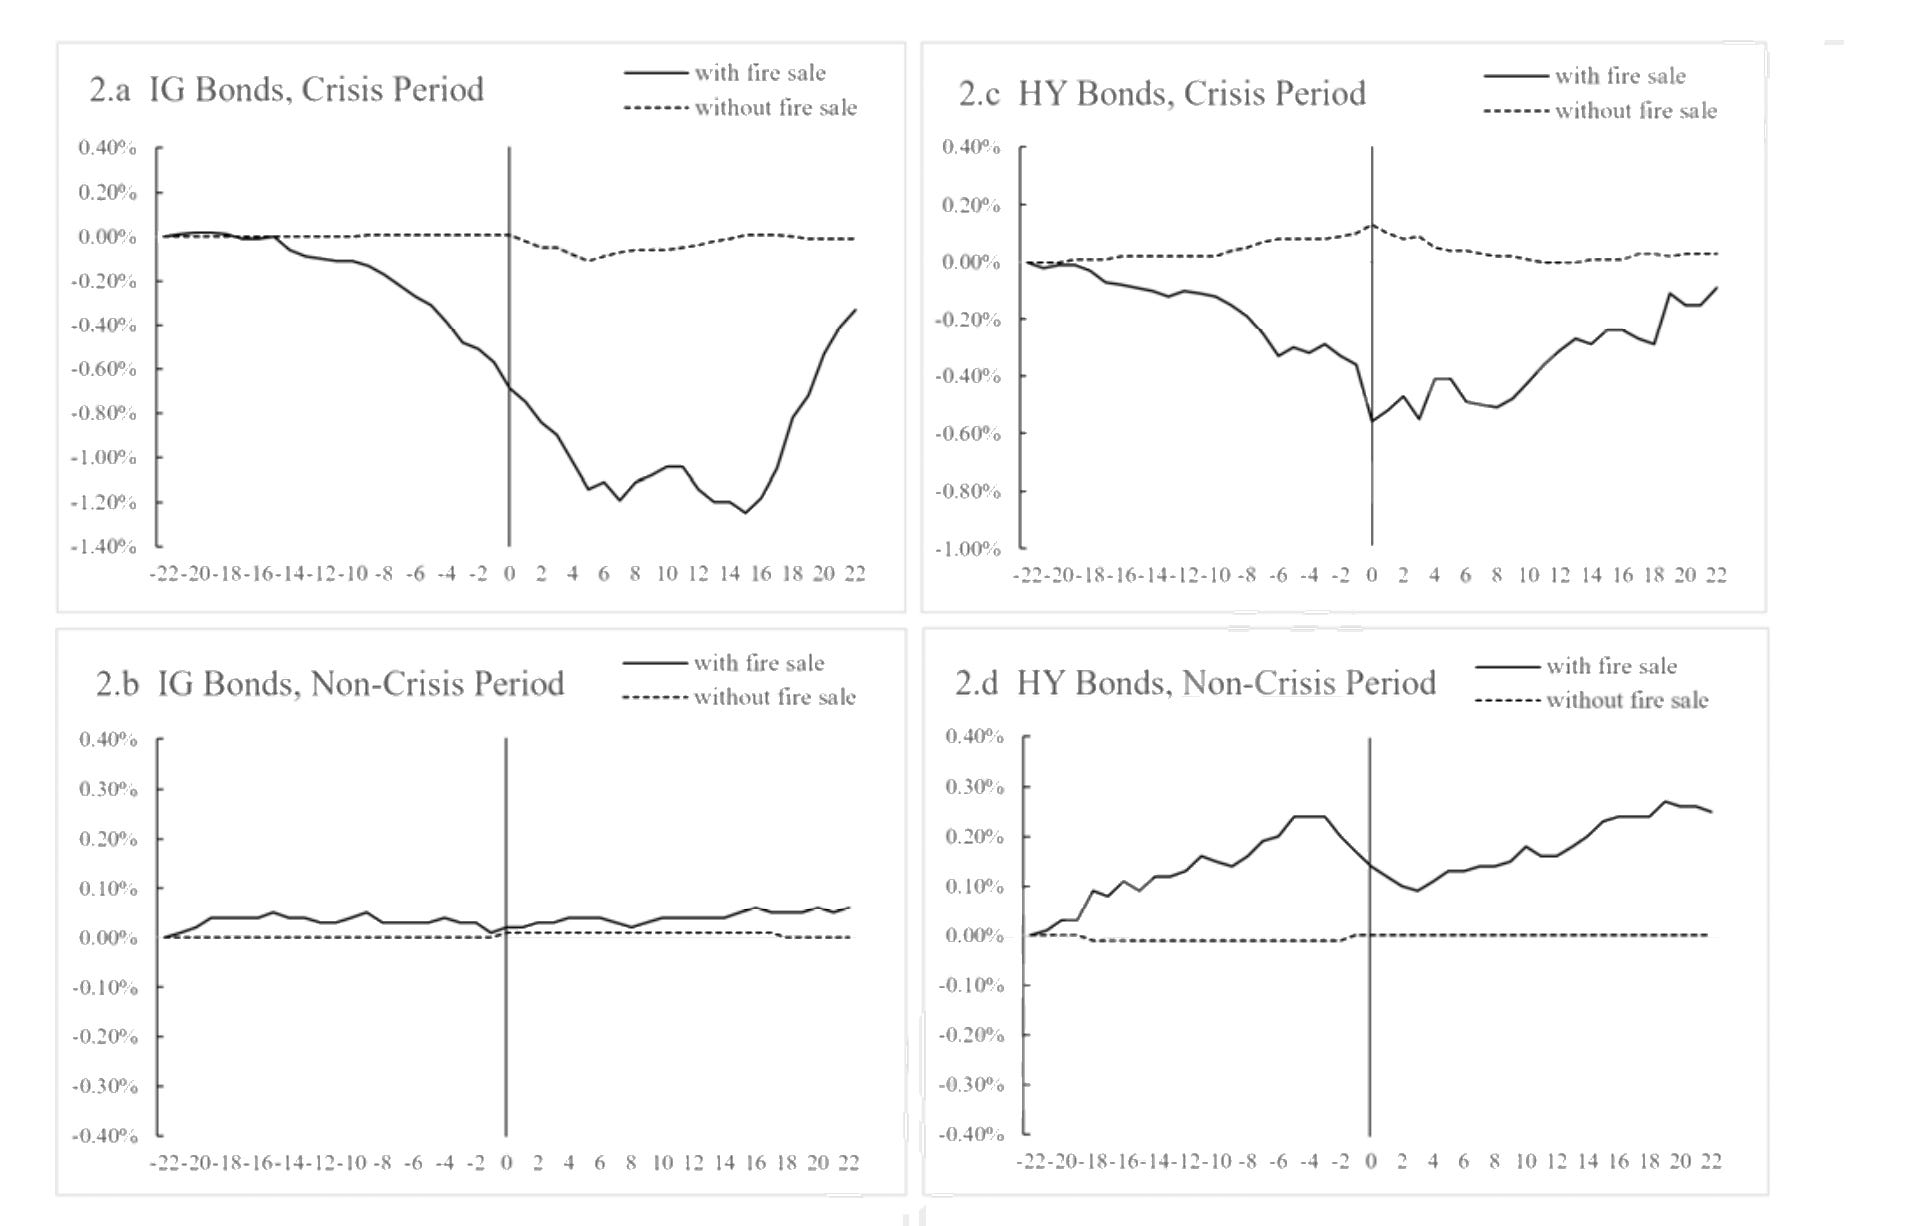
Figure 3: Cumulative abnormal returns around ETF fire sales during the COVID crisis window. Solid lines are bonds hit by fire sales, dashed lines are bonds that weren't. Source: Gao, Huang, Qin and Wang (2026), SSRN working paper, not yet peer reviewed.
The explanation is behavioral rather than mechanical. Money left IG ETFs after IG ETFs fell, chasing the decline downward, which is the feedback loop that turns an ordinary selloff into a spiral. High yield investors did the reverse and bought into the dislocation. Once the Fed announced its corporate credit facility on March 23, the penalty disappeared entirely. The takeaway is that stress shows up where selling is easy, not where credit risk is highest. Quality bonds were the ones people could actually liquidate, which is precisely why they broke.
Gao, Xin and Huang, Jing-Zhi Jay and Qin, Nan and Wang, Ying, Fire Sales by Corporate Bond ETFs During the COVID-19 Crisis. Available at SSRN: https://ssrn.com/abstract=7370046 or http://dx.doi.org/10.2139/ssrn.7370046
Governing the Founder
Dual-class shares now account for roughly a third of U.S. IPOs, and the standard story that they exist to lock founders into their seats does not survive contact with the data.
The authors built a new database of U.S. IPOs since 2000 and find the share listing with unequal voting rights rose from roughly 10 percent in 2000 to about 35 percent in 2025, with nearly all the growth coming from venture-backed technology firms led by their founders. Founder-CEOs and founder-directors are much more common at these companies, yet the rest of the governance picture looks ordinary (board size, independence, and committee structure barely differ from single-class peers).
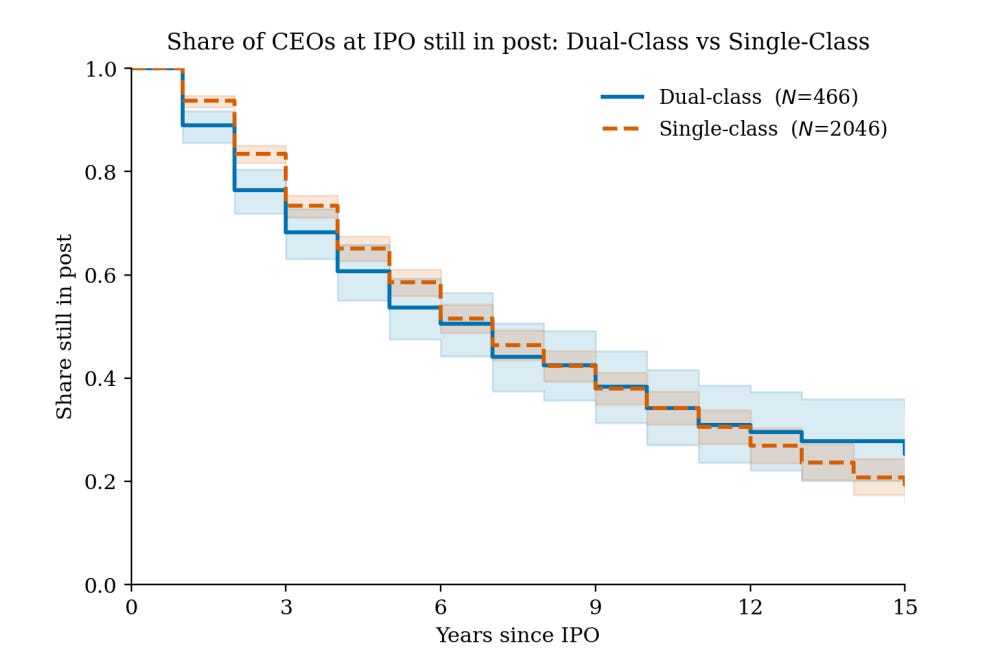
Figure 4: Founders with supervoting shares do not outlast anyone. The two lines track the odds that the CEO at listing is still in the chair years later, and the fact that they overlap is the evidence against the entrenchment story.
The entrenchment story runs into trouble on turnover. Dual-class CEOs do not stay in office longer, and their odds of being replaced still respond to poor performance. As the authors put it, “the question is perhaps not how long a person holds a role” but how much they can accomplish while in it.
Recent theory pushes further, showing that separating votes from cash flow rights can make control transfers easier rather than harder. Voting structure alone is a weak signal of governance quality, and treating every dual-class listing as an automatic discount ignores how unsettled the evidence on value still is.
Adams, Renée B. and Ferreira, Daniel, The Governance of Dual-Class Firms (August 27, 2026). Forthcoming in B. E. Eckbo (ed.), Handbook of the Economics of Corporate Finance, Vol. 2: Corporate Takeovers and the Market for Corporate Control (North-Holland/Elsevier, Amsterdam, Netherlands), European Corporate Governance Institute – Finance Working Paper Forthcoming, Available at SSRN: https://ssrn.com/abstract=7360478 or http://dx.doi.org/10.2139/ssrn.7360478
This week for paid subscribers
Paid subscribers are getting a look at why the option market's volatility forecast is sharp at one week and actively harmful at one quarter, and how a simple out-of-sample rescaling that strips out the variance risk premium turns a negative forecast score positive. This post separates bias repair from genuine predictive skill, tests the fix across stress regimes, and maps it onto volatility drag in leveraged and inverse ETFs. Python backtest code included.

Disclaimer: The content provided in this newsletter, "Alpha in Academia," is for informational and educational purposes only. It should not be construed as financial advice, investment recommendations, or an offer or solicitation to buy or sell any securities or financial instruments. Past performance is not indicative of future results. The financial markets involve risks, and readers should conduct their own research and consult with qualified financial advisors before making any investment decisions.
The interpretations, opinions, and analyses presented herein are those of the author and do not necessarily reflect the views of the original researchers, their institutions, or the full implications of the cited academic papers. While every effort is made to accurately represent the research discussed, readers should be aware that the summaries and interpretations may not capture the full scope or nuances of the original studies. The information contained in this newsletter is believed to be accurate and reliable at the time of publication, but accuracy and completeness cannot be guaranteed. The author and publisher accept no liability for any loss or damage resulting from reliance on the information provided.
This newsletter may contain links to external websites or resources. The author is not responsible for the content, accuracy, or reliability of these external sources.
By subscribing to or reading this newsletter, you acknowledge that you have read and understood this disclaimer and agree to hold the author and publisher harmless from any liability that may arise from your use of the information contained herein.