Hello and welcome back to another paid post!
Today we’re looking at a number that claims to tell you how turbulent the next month will be. It is called the VIX, and it is one of the most-watched figures in finance. The question this piece asks is narrower and more useful than the usual VIX commentary: if you actually tried to forecast future market volatility with it, when would it help you, and when would it quietly lead you astray? The answer turns out to depend almost entirely on one thing you would not expect to matter so much. How far ahead you are looking.
Let’s dive right in.
A signal that points forward
Most financial data looks backward. Yesterday’s returns, last quarter’s earnings, the trailing average of almost anything. These are facts about what already happened, and the hope is that the recent past rhymes with the near future. Option prices are different. When traders buy and sell options on the S&P 500, they are placing bets about what the market will do between now and the option’s expiry. Bundle those bets together the right way and you get a forward-looking estimate of volatility, an expectation of turbulence extracted from where real money is being wagered right now. The VIX is exactly this: the market’s expected volatility over roughly the next month, distilled into a single number.
That sounds like it should dominate any backward-looking measure. Why average the last twenty days of market movement when you could read the crowd’s forecast of the next twenty directly? For short horizons, that intuition is right. The trouble begins when you ask the signal to reach further than it naturally sees.
To test this properly we need to be strict about one thing. Every forecast in this piece is made using only information that existed at the moment of the forecast. When we estimate how the option signal should be adjusted, we use only data from before that day. This is called an out-of-sample test, and it is the difference between a strategy that works and a strategy that merely looks good in hindsight. A model fitted on the whole history and then tested on that same history is grading its own homework. We never do that here.
The measuring stick
To judge any forecast we need a scoring rule and a baseline. The baseline is deliberately humble: a running historical average of realized volatility, the simplest honest forecast anyone could make. The scoring rule is called out-of-sample R-squared, and it answers a single question. Did this forecast produce smaller errors than the humble historical average?
A positive score means the forecast beat the running average. A score of zero means it merely tied. And a negative score, which will matter enormously in a moment, means the sophisticated forecast was worse than simply assuming the future looks like the recent past. Negative is not a weak positive. Negative means you would have been better off ignoring the fancy signal entirely.
We test three time horizons. One week ahead, roughly five trading days. One month ahead, twenty-two trading days, which is about where the VIX is designed to point. And one quarter ahead, sixty-six trading days, where we swap in a longer-dated cousin of the VIX called the VIX3M that targets three months instead of one. For each horizon we compare the raw option signal, a calibrated version of it we will build shortly, and a well-constructed forecast built purely from historical volatility.
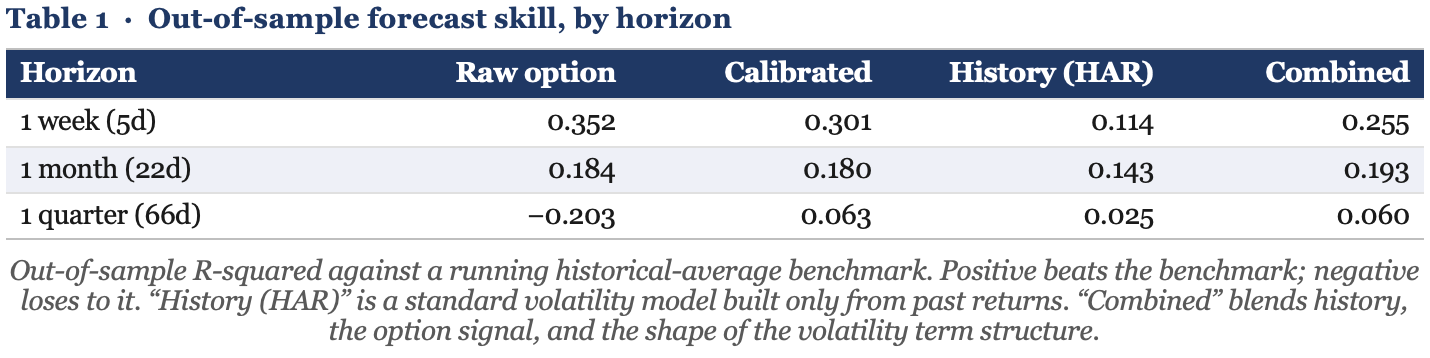
Read the top row and the option signal looks brilliant. At one week, the raw signal scores 0.352, crushing the history-only model’s 0.114. At one month it still leads, 0.184 against 0.143. The forward-looking signal is doing exactly what forward-looking signals are supposed to do.
Now read the bottom row. At one quarter, the raw option signal scores minus 0.203. It did not just lose its edge. It became actively harmful, producing forecasts meaningfully worse than a running historical average that a person could compute on a napkin. The same signal that was the star performer at one week is a liability at one quarter. That reversal is the whole story, and it deserves an explanation rather than a shrug.