

Welcome back to another issue of Recent Academic Research!
Let’s get into it.
Private Equity's "Free Lunch" Was Just a Pricing Illusion
When you value buyout funds at real market prices instead of sponsor-reported estimates, their famous risk-adjusted outperformance disappears entirely.
Private equity has long sold itself as the rare asset that beats stocks while smoothing out the ride, low volatility, low correlation, better returns. This paper tests that claim using a clever workaround: a set of buyout funds that trade on European stock exchanges, giving researchers both the official NAV (the fund’s own periodic self-appraisal) and the actual price investors are willing to pay for the same assets, every day. The gap is striking. Priced at NAV, these funds look tame, with volatility close to public stocks. Priced at market, volatility jumps to 29%, correlation with stocks climbs to 0.94, and beta lands around 1.5, meaning these funds are about 50% more volatile than the market, not less. Once that real risk is accounted for, the outperformance vanishes, with alpha statistically indistinguishable from zero.
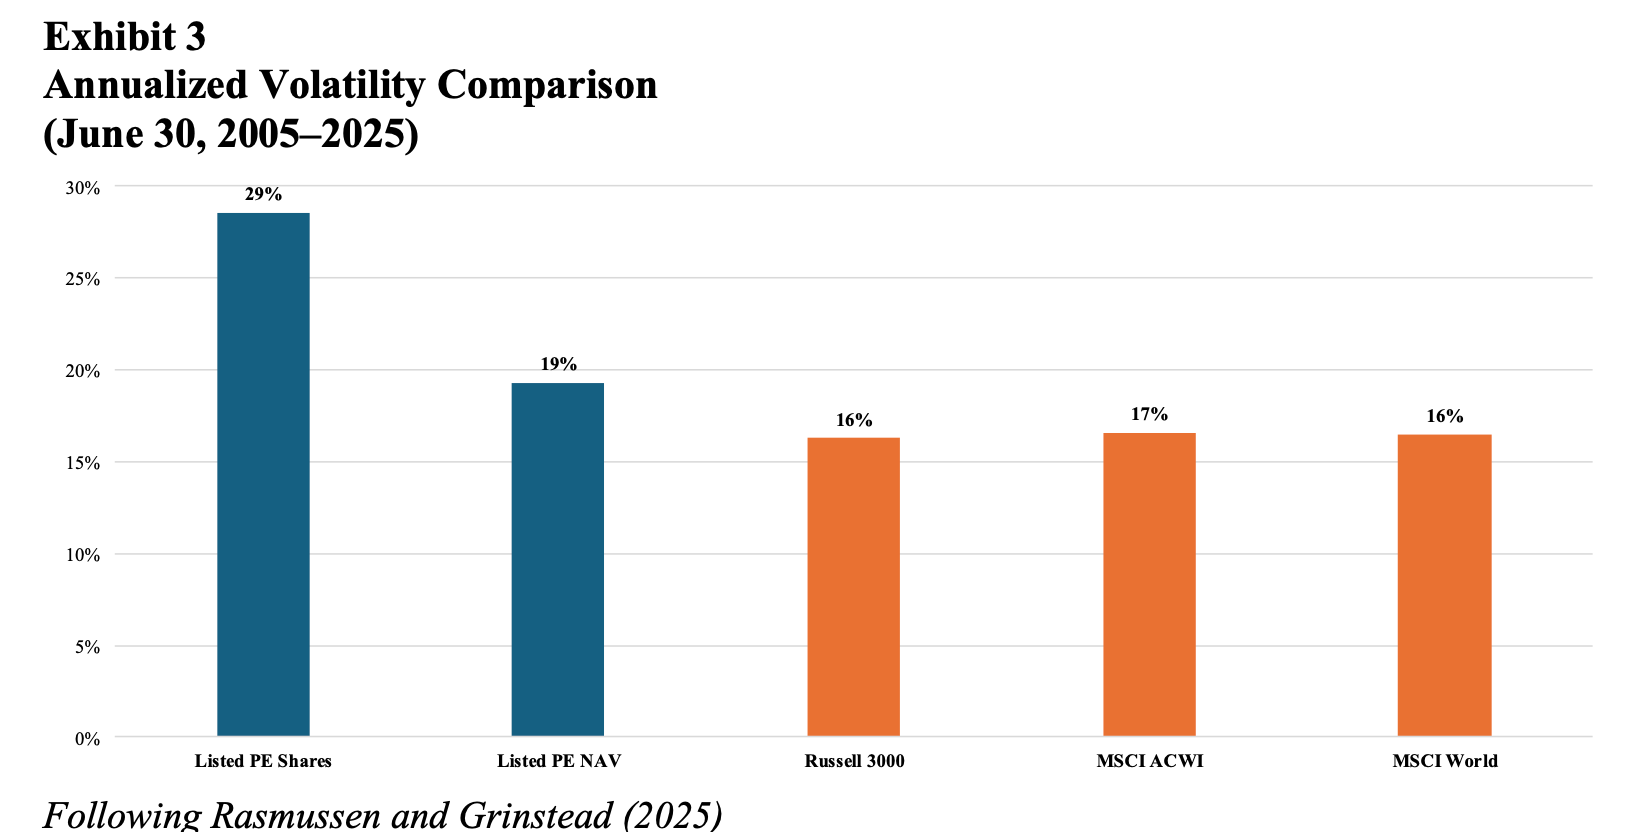
The authors frame it plainly: NAV-based accounting lets buyouts “appear to generate significant alpha” that isn’t really there. For investors leaning on private equity as a smoother, higher-returning complement to stocks, this is a reason to check whether that cushion is real or just an artifact of how infrequently the assets get marked to market.
Ennis, Richard and Rasmussen, Daniel, Buyout Performance with Assets Valued at Market (July 01, 2026). Available at SSRN: https://ssrn.com/abstract=7157298 or http://dx.doi.org/10.2139/ssrn.7157298
Is Volatility Really "Rough"?
A new model suggests the popular “rough volatility” framework may be forcing two separate questions, how choppy volatility looks up close and how long its memory lasts, into a single number, and separating them changes the picture.
For the past decade, quants have modeled market volatility as “rough,” meaning it looks jagged and unpredictable at short timescales, using a single parameter (the Hurst index) borrowed from fractal math. This paper argues that parameter is secretly doing two jobs at once, setting both how volatility scales over time and how much it remembers its own past, when those are logically different properties. Borrowing a tool from physics (originally used to model particles bouncing around in fluids), the author builds a more flexible framework that lets memory and scaling move independently. Testing it on real order book and stock data, two of the model’s predictions hold up clearly: volatility’s memory decays slowly rather than instantly, and there’s a measurable asymmetry where past price moves predict future volatility more than the reverse.
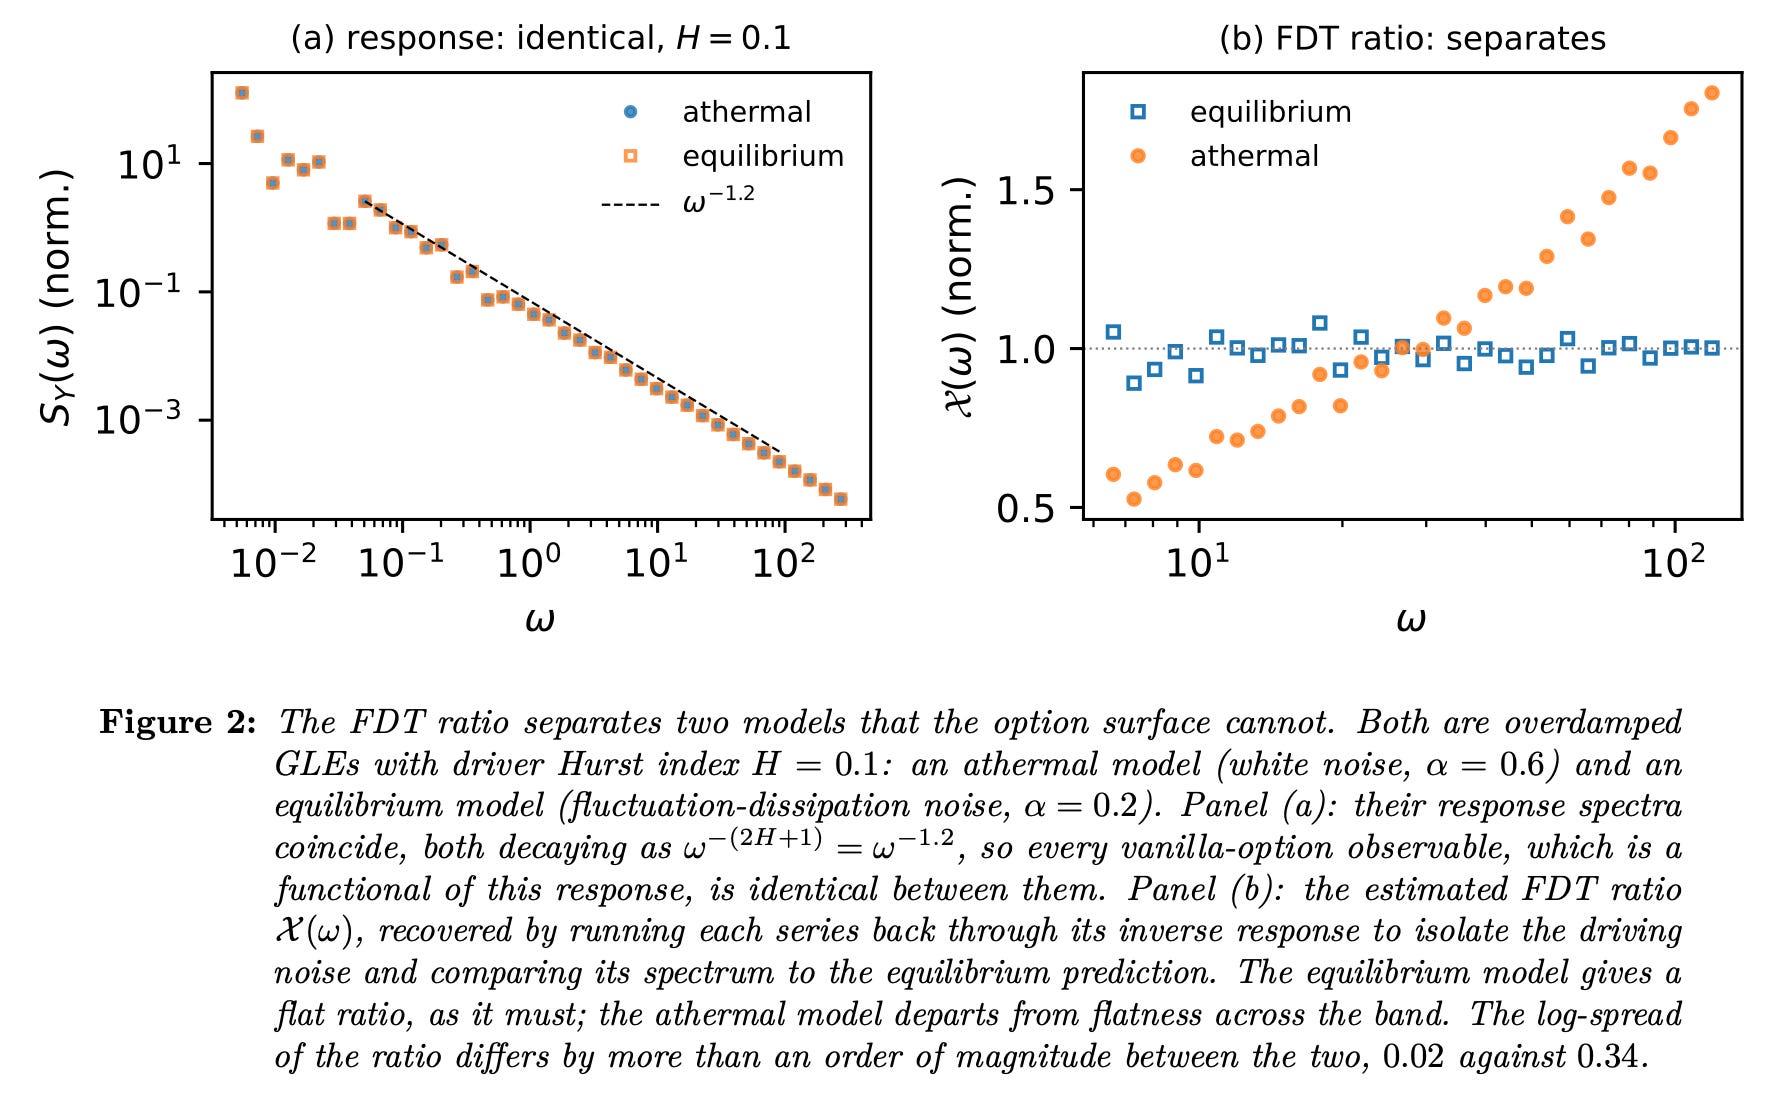
The short-term “roughness” question, though, turns out to be essentially unmeasurable with current data, neither confirmed nor ruled out. For traders and risk modelers, this matters because it suggests some volatility models may be more constrained than the data actually requires, and that memory in markets is a real, testable phenomenon rather than just a curve-fitting trick.
Itkin, Andrey, Beyond Rough Volatility: Decoupling Memory and Scaling via a Generalized Langevin Equation (July 29, 2026). Available at SSRN: https://ssrn.com/abstract=7202798 or http://dx.doi.org/10.2139/ssrn.7202798
When the Spread Doesn't Come Back: The Math of Knowing When to Stop
Capping your position size in a pairs trade doesn’t just limit your losses, it actually changes the optimal trade itself, because a smart investor starts hedging against future limits before they ever get hit.
Pairs trading lives and dies on one assumption: that two related stocks, after drifting apart, eventually snap back together. This paper asks the uncomfortable question that assumption usually skips over, what happens when they don’t. The author builds a formal model where a trader sets hard position limits on both legs of the trade, then solves for the mathematically optimal strategy under those limits. The twist is that this constrained strategy isn’t just the unconstrained strategy clipped at the edges. Anticipating that limits might bind later, the optimal trader adjusts positions earlier than you’d expect, even while still comfortably within bounds.
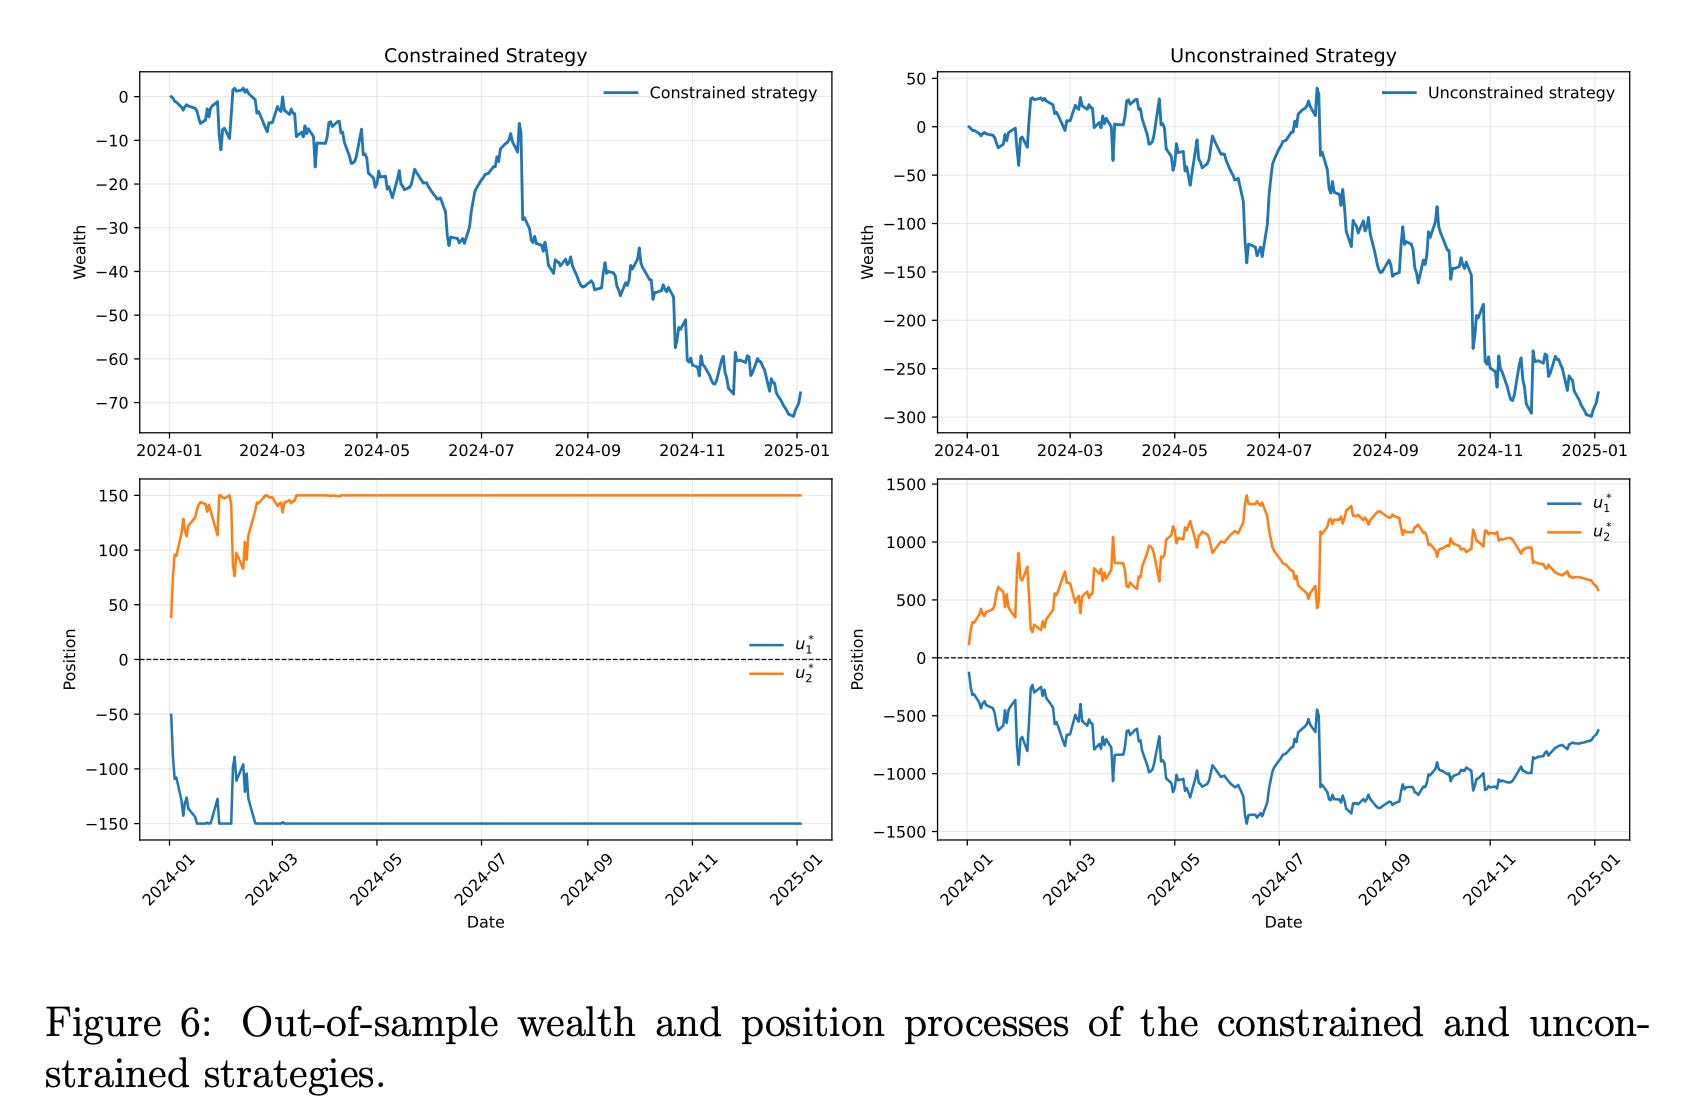
Tested on Ford and GM stock from 2022 to 2024, a period where their prices diverged and stayed diverged, the constrained strategy lost about 70 dollars per unit of capital versus roughly 280 for the unconstrained version. The takeaway for anyone running a spread trade: sizing discipline isn’t just risk management bolted on afterward, it should shape the trade from day one.
Chen, Ziyi, Optimal Pairs Trading with Position Constraints (July 30, 2026). Available at SSRN: https://ssrn.com/abstract=7205360 or http://dx.doi.org/10.2139/ssrn.7205360
Can the Shape of a Probability Curve Predict a Crash Before Volatility Does?
A new early-warning model that reads the geometry of market volatility, not just its size, flagged the COVID crash and the 2022 rate-hike selloff an average of 18 days before a standard volatility filter did.
Most volatility models, including the classic Markov regime-switching approach used across the industry, work by waiting for enough big price swings to pile up before declaring that markets have shifted into a stressed state. That’s inherently reactive. This paper tries something different, borrowing a tool from topology (the math of shapes and connectivity) to track how the pattern of a volatility signal reorganizes itself in the days before a real shift, not just how big it gets. Applied to JPMorgan stock and the S&P 500 from 2020 through 2024, this topological layer detected the two biggest volatility events of that period nearly three weeks earlier than the standard model, and the signal was statistically unrelated to VIX or realized volatility, meaning it’s genuinely picking up something different rather than just repackaging existing data.
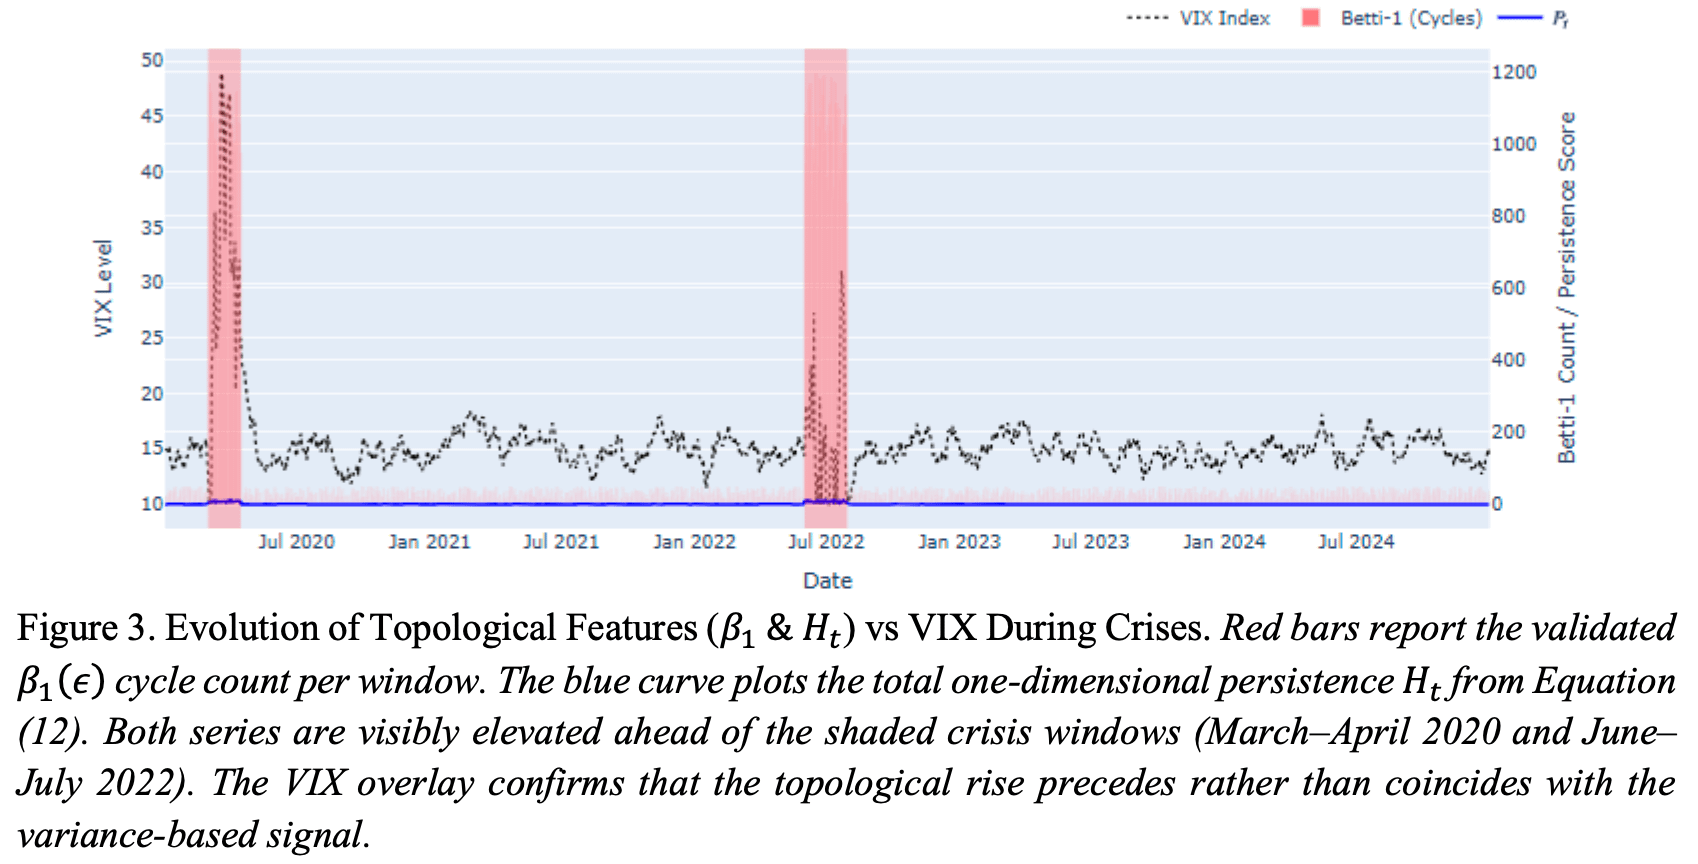
The catch is that this early-warning system throws a lot of false alarms, roughly seven flagged windows out of ten turn out to be nothing, so it’s built to work as a tripwire that prompts a closer look, not a system that trades on its own. For risk managers and active investors, that tradeoff, faster warning bought with more noise, is worth understanding before leaning on any signal that claims to see trouble coming early.
Faris, Mahrus, Early-warning Volatility Regime Detection in Equity Markets: A Combined Markov Switching and Persistent Homology Approach (July 20, 2026). Available at SSRN: https://ssrn.com/abstract=7206123 or http://dx.doi.org/10.2139/ssrn.7206123
This week for paid subscribers
Paid subscribers are watching the G10 currency carry trade erase two decades of calm-regime gains across high-volatility selloffs, then testing whether an implied equity volatility filter can predict those crash regimes in advance. It isolates the funding-driven unwinds that destroy the trade and is blind to the basket’s own realized volatility, with a simple 80th-percentile threshold turning a zero-Sharpe basket into a 0.32 net Sharpe. Python backtest code included.

Disclaimer: The content provided in this newsletter, “Alpha in Academia,” is for informational and educational purposes only. It should not be construed as financial advice, investment recommendations, or an offer or solicitation to buy or sell any securities or financial instruments. Past performance is not indicative of future results. The financial markets involve risks, and readers should conduct their own research and consult with qualified financial advisors before making any investment decisions.
The interpretations, opinions, and analyses presented herein are those of the author and do not necessarily reflect the views of the original researchers, their institutions, or the full implications of the cited academic papers. While every effort is made to accurately represent the research discussed, readers should be aware that the summaries and interpretations may not capture the full scope or nuances of the original studies. The information contained in this newsletter is believed to be accurate and reliable at the time of publication, but accuracy and completeness cannot be guaranteed. The author and publisher accept no liability for any loss or damage resulting from reliance on the information provided.
This newsletter may contain links to external websites or resources. The author is not responsible for the content, accuracy, or reliability of these external sources.
By subscribing to or reading this newsletter, you acknowledge that you have read and understood this disclaimer and agree to hold the author and publisher harmless from any liability that may arise from your use of the information contained herein.