

Hello and welcome back to another paid post!
Today we are looking at the G10 currency carry trade, and at the ETF that existed to sell it to retail investors between 2006 and 2023. Rebuilt from free data, the basket returned 0.74% annualized over nineteen and a half years on 9.8% volatility, which is a Sharpe ratio of 0.07. Taking realistic costs into consideration, it returned nothing at all.
That number is an average of two regimes that happen to cancel. In the calmest fifth of the sample, the basket earned 4.8% annualized, whereas in the most stressed fifth, it lost 15.6%. The stressed regime can be identified in advance, but only with implied equity volatility. The basket’s own realized volatility tells you nothing useful, and realized equity volatility gets you about half way. There is also a construction quirk in the original index that turns out to have been hedging the crash risk by accident.
Let’s dive right in.
Introduction
Carry is the oldest trade in currency markets. Borrow where rates are low, lend where they are high, keep the spread. Uncovered interest parity says the high-yielding currency should depreciate by exactly the interest differential and leave you flat, and it does not, which is why the trade has a forty-year academic literature behind it.
The Deutsche Bank G10 Currency Future Harvest Index formalized it about as plainly as possible. Rank the G10 currencies by yield, go long the top three at a third of NAV each, short the bottom three the same way. Gross notional of 200%, rebalanced quarterly. The index was calculated back to March 1993 at a base of 100, and by July 25, 2007, it stood at 315.27.
In September 2006, an ETF launched to track it: DBV, the Invesco DB G10 Currency Harvest Fund. It ran for a little over sixteen years and was liquidated on March 10, 2023.
So the index tripled, then the product arrived, then nothing happened for sixteen years. That sequence is what this post is about. The question is not whether the carry premium exists in the data, because it does. The question is what it did during the only window in which an ordinary investor could have bought it.
Data and Methodology
Daily spot rates for the nine non-USD G10 currencies from Yahoo Finance, normalized to USD per unit of foreign currency so a rise always means the foreign currency strengthened. Three-month interbank rates from FRED’s OECD series. DBV, VIX and S&P 500 history are from Yahoo.
The sample runs from June 2006, where AUD spot history begins, to December 2025, where every currency still has published rate coverage.
Three construction choices, all taken from the fund’s final 10-K:
Ranking uses the previous month’s rate observation, lagged so that nothing in a given month depends on data published during it. The index actually ranked on a currency carry ratio (front-month futures over the three-month futures) rather than cash rates, and rebalanced quarterly rather than monthly. Interbank rates are observable live, so my lag is stricter than it needs to be.
The dollar is ranked but never traded. When USD lands in the top or bottom three, that leg is simply not established and gross exposure falls to about 1.67:1. This happened in 65.4% of months in the sample, which is more often than I expected, and it matters later.
Returns are excess returns: the spot move plus the interest differential against USD. DBV shareholders received excess return plus collateral income minus 0.78% in fees, so the comparison against the fund adds those back.
The Reconstruction Tracks the Fund
Before trusting any of this it needs to match the thing it claims to replicate.
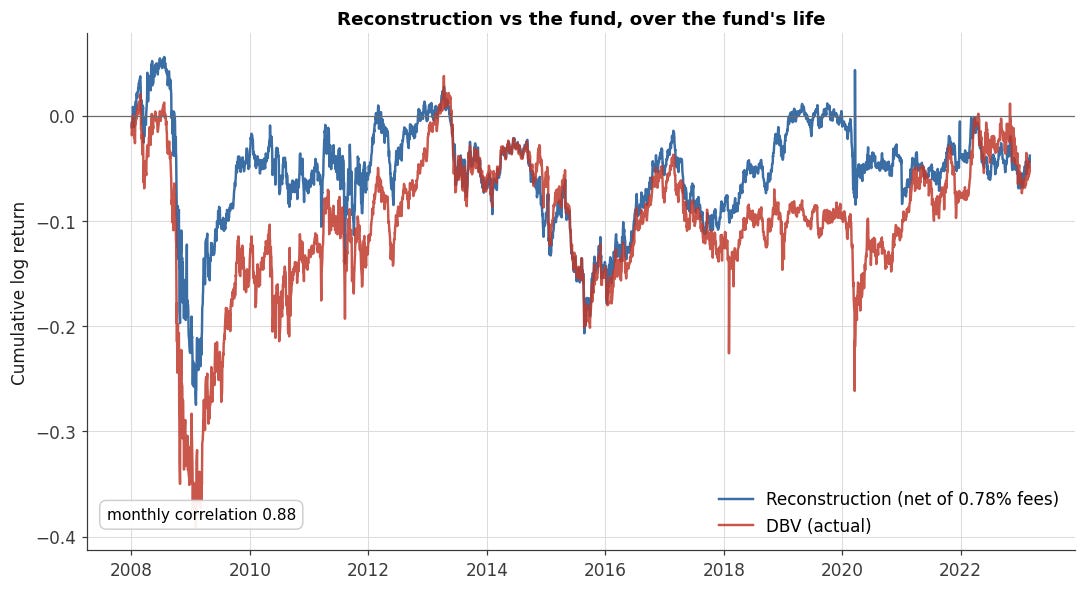
Figure 1: The reconstruction net of fees against DBV’s actual returns over the fund’s listed life. Daily correlation is 0.29, which looks alarming until you notice it is a clock problem rather than a disagreement.
Over the fund’s life, the reconstruction returned −0.25% annualized against DBV’s −0.34%, on volatility of 10.5% against 12.1%, with daily skew of −0.64 against −0.86.
The daily correlation of 0.29 is a measurement artifact. Yahoo’s spot quotes are a 24-hour snapshot taken at an arbitrary time; DBV was a 4pm Arca close on futures that settled at 2pm. Different clocks. Aggregate the returns and the gap closes: 0.61 weekly, 0.88 monthly, 0.90 quarterly.
Twenty Years of Nothing
Here is the full sample.
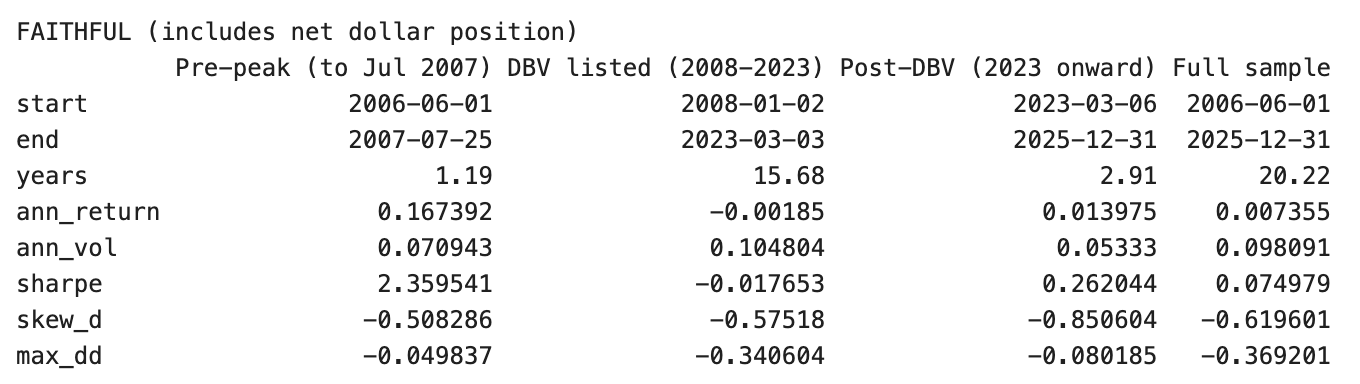
Read the columns from left to right. The first is fourteen months, and it sits on the terminal blow-off of the largest carry run in modern history, so I am not going to use it for anything. The middle column is the fund's entire listed life. The one to its right is what happened after it closed: 1.4% annualized at a Sharpe of 0.26, and 2.3% at 0.40 once the accidental dollar position comes out.
Carry did not stop paying. It paid on either side of the window in which you could buy it. This shows that it is not underperformance against a benchmark. Over nineteen and a half years, the trade produced nothing, while taking a 37% drawdown and carrying negative skew the whole way. You held a left tail and were paid zero for it.
DBV tracked that faithfully. The fund was not the problem, and the fees were not the problem either. The strategy did this.
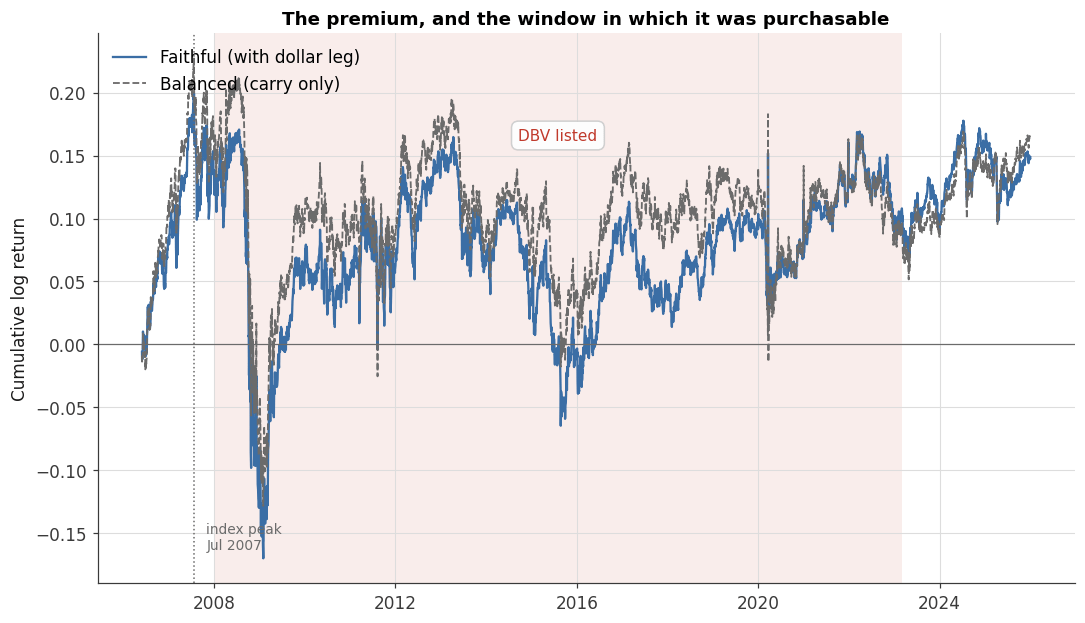
Figure 2: The reconstructed basket over the full sample. The shaded band is DBV’s entire life on the exchange, and the dotted line is the index’s all-time high in July 2007.
Zero is an Average
A twenty-year Sharpe of 0.07 invites the conclusion that carry stopped working, but I do not think that is what happened. Sort every day by where the VIX closed, cut it into quintiles, and the average falls apart immediately.
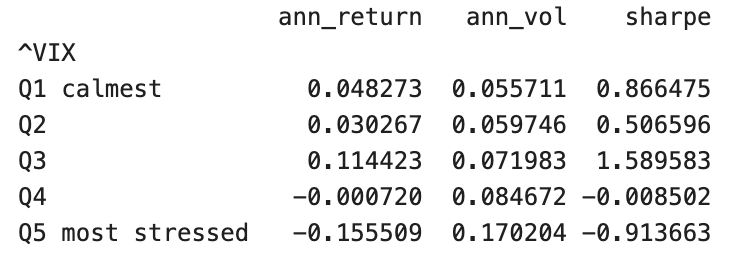
The premium is not missing. It is large, and then it is violently negative, and the two cancel. Four fifths of the sample pays, with the top fifth taking it all back. Volatility triples from Q1 to Q5, so the losses arrive levered as well as late.
The relationship is not monotonic, which is worth flagging rather than smoothing over. Q2 sits below Q1 in both the version I am showing and in the balanced version. The reliable statement is that the top two quintiles are where carry dies.
This is what “carry is short volatility” means in practice, and the claim deserves a proper test rather than an assertion. Regressing monthly returns on the monthly change in VIX gives a slope of −0.0017 with a t-statistic of −7.0. Adding a quadratic term, which tests whether the payoff bends the way a short option position does, gives a curvature coefficient with a t of −2.8 and adds 2.7 percentage points of R². Significant, and modest. The strong version of the short-volatility claim survives the test without running away with it.
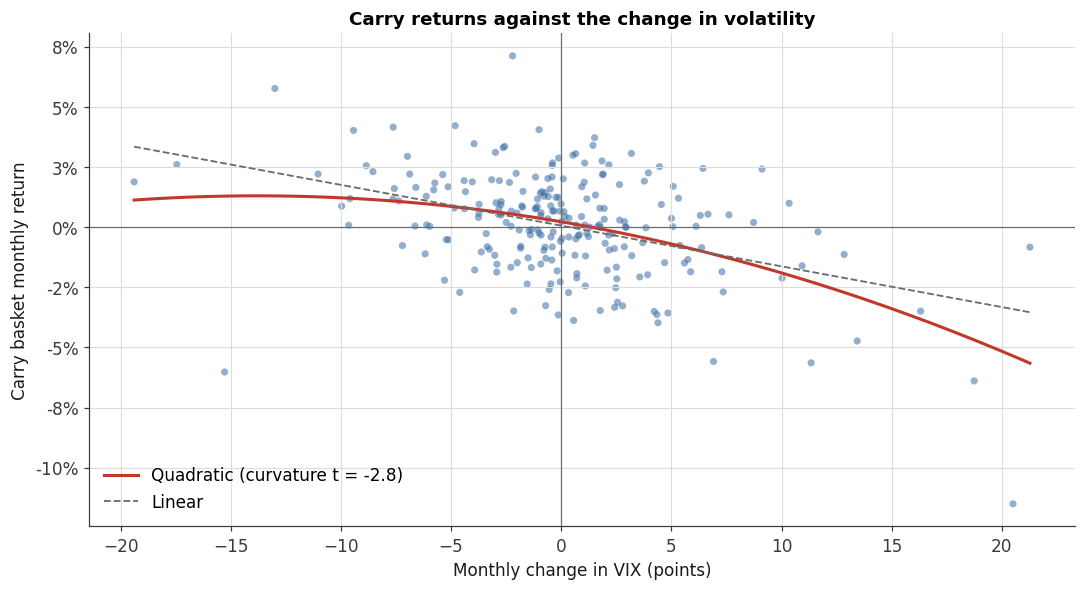
Figure 3: Each point is one month. The slope says carry dislikes rising volatility, which nobody disputes. Only the curvature says the payoff is option-like, and that is the weaker of the two results.
So, can the destructive fifth of the sample be spotted in advance?