
Recent Academic Research
An exploration of modern market microstructure and behavioral anomalies, spanning institutional order flow tracking, retail-driven cross-asset bubbles, small-cap predictability, and hidden liquidity.

Welcome back to another issue of Recent Academic Research!
Let’s get into it.
Decoding the Smart Money Trail
Institutional investors leave detectable footprints across options markets, dark pools, and the order book, and a systematic four-layer framework can help retail traders read them.
When a hedge fund takes a large directional position, it rarely announces the fact. Instead, it routes block trades through dark pools to avoid tipping its hand, sweeps call options across multiple exchanges to build leveraged exposure efficiently, and leaves a quiet but readable trail in the market’s plumbing. This paper by practitioner Vishal Chopra argues that four publicly accessible data streams, interpreted in sequence, can reconstruct much of that institutional intent: unusual options activity (particularly call or put sweeps that cross 50% of existing open interest), off-exchange volume spikes from FINRA’s weekly dark pool transparency data, large-lot patterns in the real-time tape, and price positioning relative to anchored VWAP (a volume-weighted average price calculated from a meaningful prior event rather than the daily open).
The author formalizes this into a weighted conviction score, where options flow carries the most predictive weight, followed by dark pool confirmation, tape patterns, and price structure. The framework stops well short of claiming to close the gap between retail and institutional participants entirely, but the evidence from market microstructure research it draws on is real: options order flow genuinely leads equity prices, and dark pool prints carry information about future returns. The practical question is whether the synthesis adds more than the sum of its parts.
Chopra, Vishal, Institutional Order Flow Analytics: Decoding Smart Money Signals in U.S. Equity and Options Markets: A Practitioner Framework for Identifying Informed Trading Activity Across Lit and Dark Market Venues. (June 06, 2026). Available at SSRN: https://ssrn.com/abstract=6889358
Catching Small Fish Before the Market Does
A simple, nonparametric measure of return sign dependence predicts next-day direction for the majority of small-cap stocks, while generating no edge at all in large caps.
The core intuition here is behavioral and almost disarmingly simple: if investors systematically under-react to news, positive returns should tend to follow positive returns, and negative should follow negative. The Probability Difference (PD) statistic formalizes this by measuring how often same-sign return sequences occur relative to reversals.
The clever part is what the author had to fix to make this work in equities specifically. Stocks have a positive long-run drift, which creates a false impression of momentum, and they suffer from microstructure noise (the random bounce between bid and ask prices) that obscures real patterns. The paper addresses these with a drift-adjusted null hypothesis and a threshold filter that only fires after a prior return is extreme enough to cut through the noise. Tested across 25 years of U.S. data, the adapted PD correctly predicted next-day direction for 84% of small-cap stocks, and PD-guided strategies delivered positive Sharpe ratios net of transaction costs.
Large caps showed essentially zero edge, which is exactly what you’d want to see: a model that goes quiet in efficient markets isn’t broken, it’s honest. The most striking finding is an asymmetry in where predictability lives: the signal after large positive returns is substantially stronger than after large negative ones, consistent with the disposition effect (investors hold losers too long and sell winners too soon), a pattern that notably disappears in large caps.
Semenov, Andrei, Nonparametric Directional Forecasting in Equity Markets: Size, Conditional Patterns, and Economic Payoffs. Available at SSRN: https://ssrn.com/abstract=6997954 or http://dx.doi.org/10.2139/ssrn.6997954
When Reddit Talks, Markets Move Together
Synchronized spikes in retail attention on WallStreetBets coincide with simultaneous price bubbles across NVIDIA, Bitcoin, and Ethereum, even though these assets share no fundamental economic linkage.
The GameStop saga of 2021 made it clear that retail investors coordinating on social media could move individual stocks. This paper asks a harder question: can that same coordination produce bubbles across entirely unrelated asset classes at the same time? Using hourly price and Reddit mention data from 2023 to 2024, the authors track explosive price episodes across AI stocks and cryptocurrencies using a statistical bubble-detection procedure (essentially a rolling test for whether prices are growing faster than any rational fundamental could justify). They find that NVIDIA alone registered twelve distinct bubble episodes over the sample period, with some lasting over 59 consecutive hours, and that its bubble windows overlap meaningfully with those of Bitcoin and Ethereum. The smoking gun is the attention data: during the March 2024 co-bubble episode, WallStreetBets mentions of NVIDIA ran more than four times their normal hourly rate, with Bitcoin and Ethereum mentions showing the same pattern simultaneously.
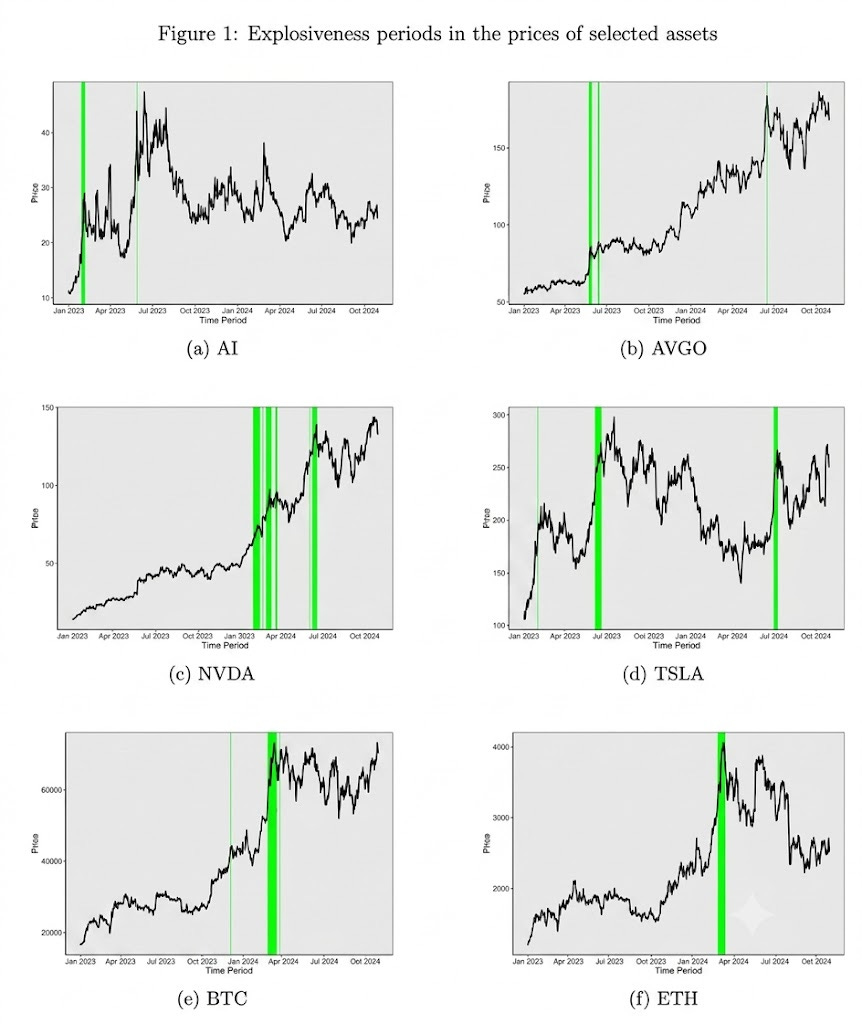
Critically, the paper distinguishes this from ordinary market connectedness: Tesla, which is economically linked to NVIDIA through AI exposure, shows return spillovers with it but no co-explosivity, suggesting that synchronized bubbles are a behavioral phenomenon driven by shared retail narratives, not just correlated fundamentals. For investors, the implication is interesting: Reddit is now a cross-asset contagion channel.
Aloosh, Arash and Choi, Hyung-Eun and Ouzan, Samuel and Shahzad, Syed Jawad Hussain, Social Media Co-Attention and Investment Co-Bubbles. Available at SSRN: https://ssrn.com/abstract=6985533 or http://dx.doi.org/10.2139/ssrn.6985533
The Hidden Third Market in Futures Rollovers
Calendar spread books in European bond futures don’t just reflect liquidity from their two underlying contracts: they generate their own, and often offer cheaper execution than trading the legs separately.
Every quarter, traders holding European government bond futures face a familiar chore: roll their position from the expiring contract to the next one. The conventional picture is a two-party handoff, with liquidity migrating from March to June. But a new paper using 127 million limit order book updates from EUREX argues there’s a third player worth watching: the calendar spread book itself. The rollover, it turns out, is better understood as a triangle than a baton pass.
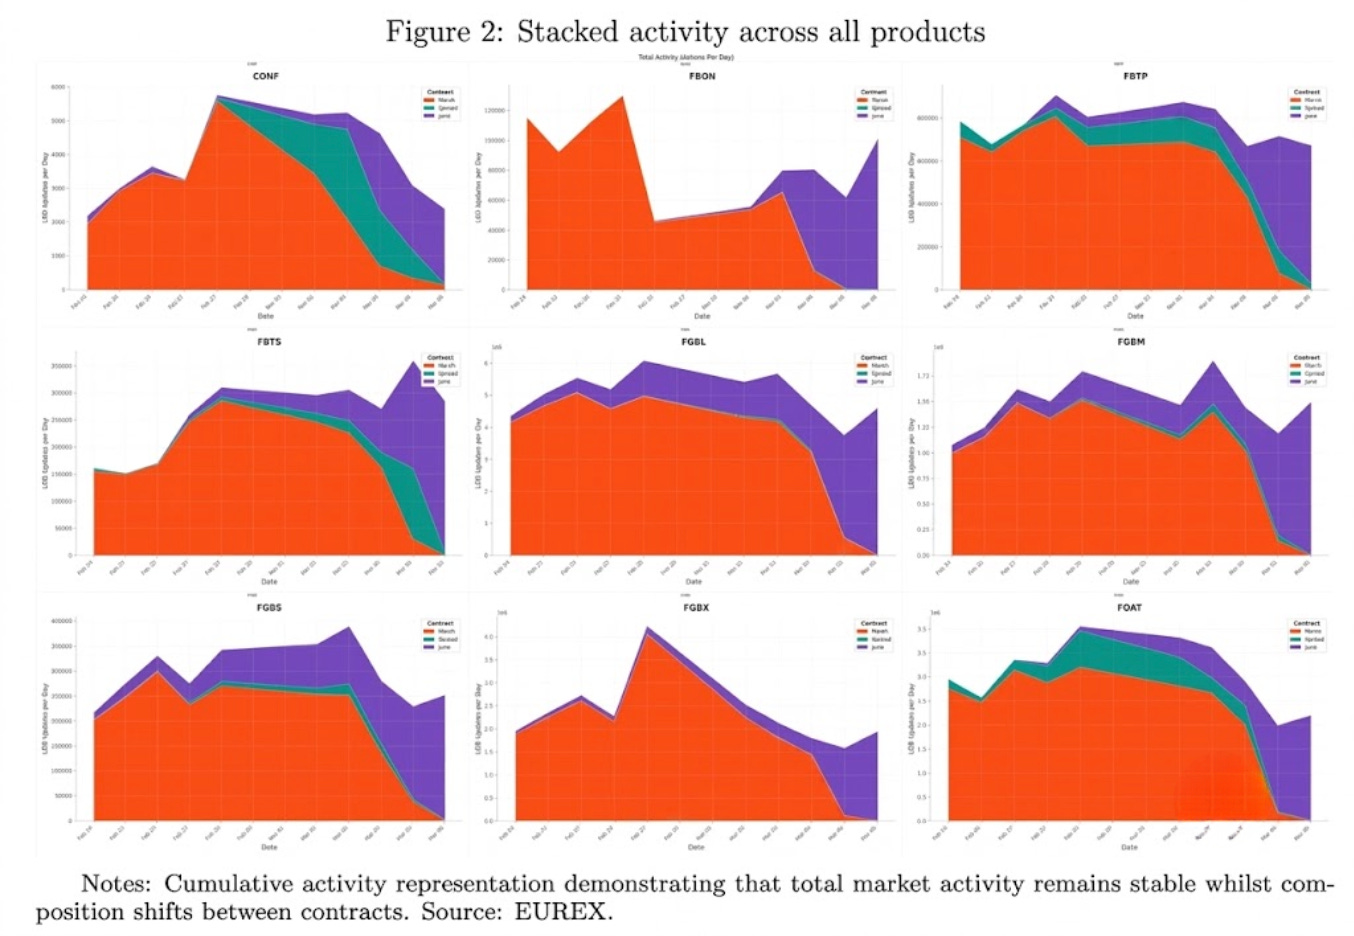
As expiry approaches, the spread book quietly accumulates a large share of displayed (resting) liquidity even while raw order activity still dominates the outright contracts, and in eight of nine futures studied, executing the roll directly through the spread book was cheaper than legging into it through March and June separately. The execution advantage was especially striking in less liquid markets. For investors executing rollovers at scale, ignoring the spread book isn’t just leaving money on the table, it’s misreading the market’s actual structure.
Uzun, Illia and Stenfors, Alexis, Calendar Spreads as Autonomous Liquidity Pools: Evidence from Triangular Rollover Dynamics in Bond Futures Markets. Available at SSRN: https://ssrn.com/abstract=6999365 or http://dx.doi.org/10.2139/ssrn.6999365
This week for paid subscribers
Paid subscribers are getting a complete seasonal-trend decomposition of the legendary “glamour market” (pork bellies), derived from a 69-year-old USDA cold-storage dataset that reveals what price action alone never could: not just when a market dies, but the exact structural decay that killed it. Python decomposition code included.

Disclaimer: The content provided in this newsletter, “Alpha in Academia,” is for informational and educational purposes only. It should not be construed as financial advice, investment recommendations, or an offer or solicitation to buy or sell any securities or financial instruments. Past performance is not indicative of future results. The financial markets involve risks, and readers should conduct their own research and consult with qualified financial advisors before making any investment decisions.
The interpretations, opinions, and analyses presented herein are those of the author and do not necessarily reflect the views of the original researchers, their institutions, or the full implications of the cited academic papers. While every effort is made to accurately represent the research discussed, readers should be aware that the summaries and interpretations may not capture the full scope or nuances of the original studies. The information contained in this newsletter is believed to be accurate and reliable at the time of publication, but accuracy and completeness cannot be guaranteed. The author and publisher accept no liability for any loss or damage resulting from reliance on the information provided.
This newsletter may contain links to external websites or resources. The author is not responsible for the content, accuracy, or reliability of these external sources.
By subscribing to or reading this newsletter, you acknowledge that you have read and understood this disclaimer and agree to hold the author and publisher harmless from any liability that may arise from your use of the information contained herein.