
Recent Academic Research
This week: the Boltzmann equation applied to options pricing, cross-market risk spillovers in Belt and Road economies, dynamic bond ladder optimization, and why generative AI widened credit spreads.

Welcome back to another issue of Recent Academic Research!
Let’s get into it.
The Boltzmann Equation in Finance
The probability distribution of a European call option’s payoff can be derived in closed form, something the literature had left unresolved for over fifty years of options research.
Textbook options pricing tells you the expected value of a call at expiration, which is what Black-Scholes gives you. But what does the full probability distribution of that payoff look like? This paper answers that question by repurposing the Boltzmann equation, originally a tool from 19th-century statistical mechanics for modeling gas particles, as a framework for financial probability distributions. The key result is a closed-form expression that decomposes the call payoff distribution into two pieces: a spike at zero (the probability the option expires worthless) and a log-normal-shaped distribution over positive payoffs (the probability it gets exercised).
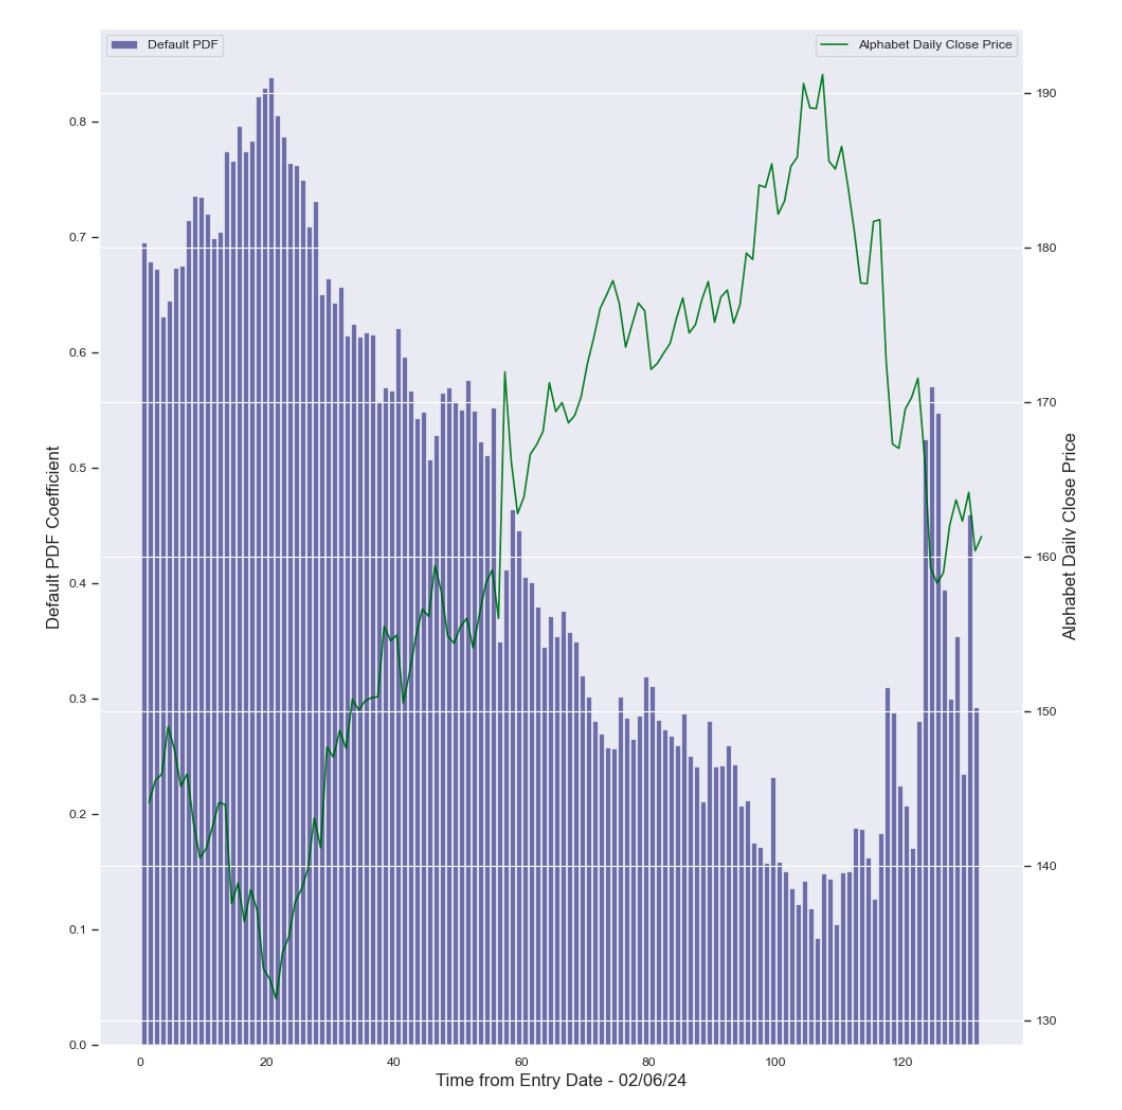
Figure 1: Default PDF Coefficient and Closing Price of Alphabet as a function of the entry time.
The authors track this distribution over the 138-day life of an Alphabet call option and show it behaves exactly as intuition demands, widening when the stock has room to move and collapsing to near certainty as expiration approaches. The expected value of this distribution recovers the standard Black-Scholes price, so the new result is consistent with existing theory while being strictly more informative. For risk managers and traders, knowing the full distribution, not just the mean, is what actually lets you size positions and calculate tail risk properly.
Bogliardi, Michele and Charif Khalifi, Zoubida and Kitapbayev, Yerkin and Noguer I Alonso, Miquel and Occhionero, Giulio and Zubelli, Jorge, The Boltzmann Equation in Finance (October 01, 2024). Available at SSRN: https://ssrn.com/abstract=4972632 or http://dx.doi.org/10.2139/ssrn.4972632
Cross-market risk spillovers in Belt and Road Initiative economies
In Belt and Road Initiative financial markets, stock markets are tightly integrated while bond markets remain surprisingly segmented, and Singapore along with Eastern European economies consistently export risk while China persistently absorbs it.
Across 17 economies spanning East Asia, Southeast Asia, South Asia, and Central and Eastern Europe, financial shocks don’t travel equally. This paper maps risk spillovers across stock, bond, and foreign exchange markets simultaneously, a more complete picture than the usual single-market studies. The stock market is the most interconnected (averaging 67% spillover intensity), bonds the most segmented (44%), and FX sits in between.
The pattern of who sends and who receives risk is strikingly consistent across all three markets: Poland, the Czech Republic, and Singapore are persistent exporters of volatility, largely because of their deep ties to European financial infrastructure, while China absorbs external shocks across equities, bonds, and currency alike despite being the world’s second-largest economy. COVID-19 caused a synchronized spike across all three markets, but the Russia-Ukraine war only disrupted currency markets, leaving stocks and bonds relatively unaffected. One counterintuitive driver: rising global policy uncertainty actually reduces cross-border spillovers, because institutions pull capital home rather than rebalancing across markets. For anyone building emerging-market or BRI-focused portfolios, the key takeaway is that China’s financial markets behave more like shock absorbers than shock originators.
Zhang, Kaige and Yao-Peng, Li and Wu, Xin, Cross-market risk spillovers in Belt and Road Initiative economies . Available at SSRN: https://ssrn.com/abstract=6922454 or http://dx.doi.org/10.2139/ssrn.6922454
Strategies for Dynamic Bond Ladder Portfolios
Traditional bond ladders passively roll to maturity regardless of yield curve conditions, but framing each rung as an optimal stopping decision, sell now or preserve the option to sell later, lets institutional portfolios adapt dynamically without abandoning the ladder structure entirely.
Bond ladders are a staple of insurance and pension fund investing: buy bonds with staggered maturities, collect coupons, reinvest when bonds mature. Simple, predictable, widely used. The problem is that passive ladders can’t respond when the yield curve shifts regime, say from normal to inverted, and holding legacy low-coupon bonds while short-term rates surge is a loss you could have avoided. This paper proposes treating each ladder rung as an American-style option, where the manager solves a sequential decision problem: at each monthly interval, should you sell a bond outright, strip its coupons to extract near-term liquidity while keeping the principal, or just hold?
The framework computes the value of acting now against the value of preserving the right to act later, the core insight of optimal stopping theory applied here to fixed income. In a simulated 20-year experiment spanning a normal-to-inverted yield curve transition, the adaptive ladder reduced drawdown and tail risk relative to passive buy-and-hold, without converting the portfolio into an unconstrained trading strategy. The remaining obstacle for real-world adoption is computational cost, since solvency models at insurers and pension funds run across thousands of scenarios repeatedly.
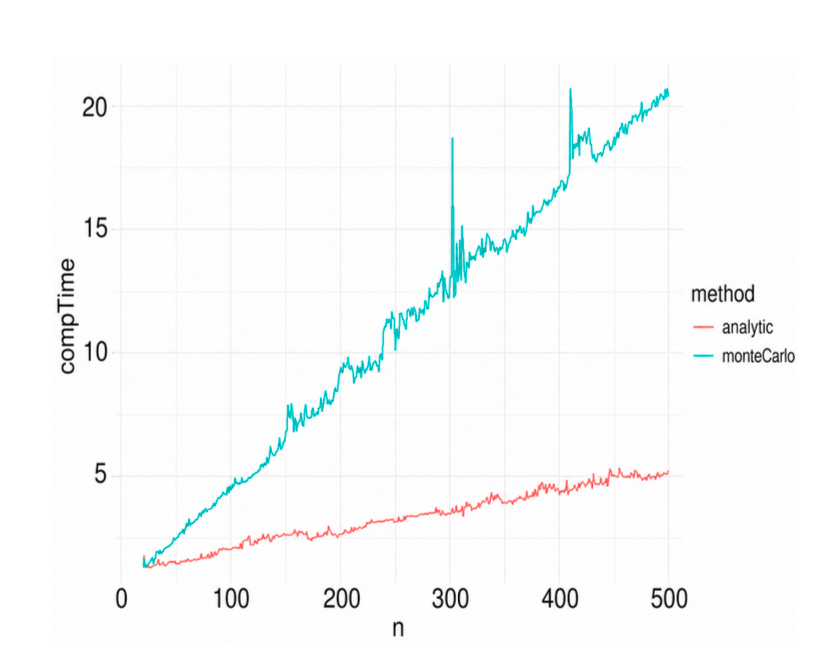
Figure 2: Computational time (seconds) comparison between the analytic Gram–Charlier approximation and Monte Carlo value-function evaluation.
The analytic approximation developed here runs substantially faster than brute-force simulation while closely matching its results, making the framework feasible for the production models institutions actually rely on.
Chudtong, Mantana and Peters, Gareth and Anderson, Avery and Yan, Haoran, Optimal Multiple-stopping Strategies for Dynamic Bond Ladder Portfolios (May 27, 2026). Available at SSRN: https://ssrn.com/abstract=6835362
Generative AI and Corporate Credit Spreads
Firms with more AI-exposed workforces saw rising stock prices and rising borrowing costs at the same time, a split that standard finance theory struggles to explain.
When ChatGPT launched in November 2022, something strange happened in corporate bond markets. Companies whose employees were most exposed to AI-driven automation got more expensive to borrow from, not cheaper. Researchers document that credit spreads widened by roughly 6 to 8 basis points per standard deviation of AI workforce exposure, a larger shift than what typical policy uncertainty shocks produce. The puzzle is that these same firms saw their stock prices rise, meaning equity and debt investors looked at the same shock and reached opposite conclusions about firm risk. The explanation lies in what economists call parameter uncertainty: in late 2022, nobody knew the true cost, success rate, or competitive fallout of actually deploying generative AI at scale. Equity, as a claim that benefits from upside optionality, priced in the opportunity. Debt, as a claim sensitive to downside risk, priced in the uncertainty.
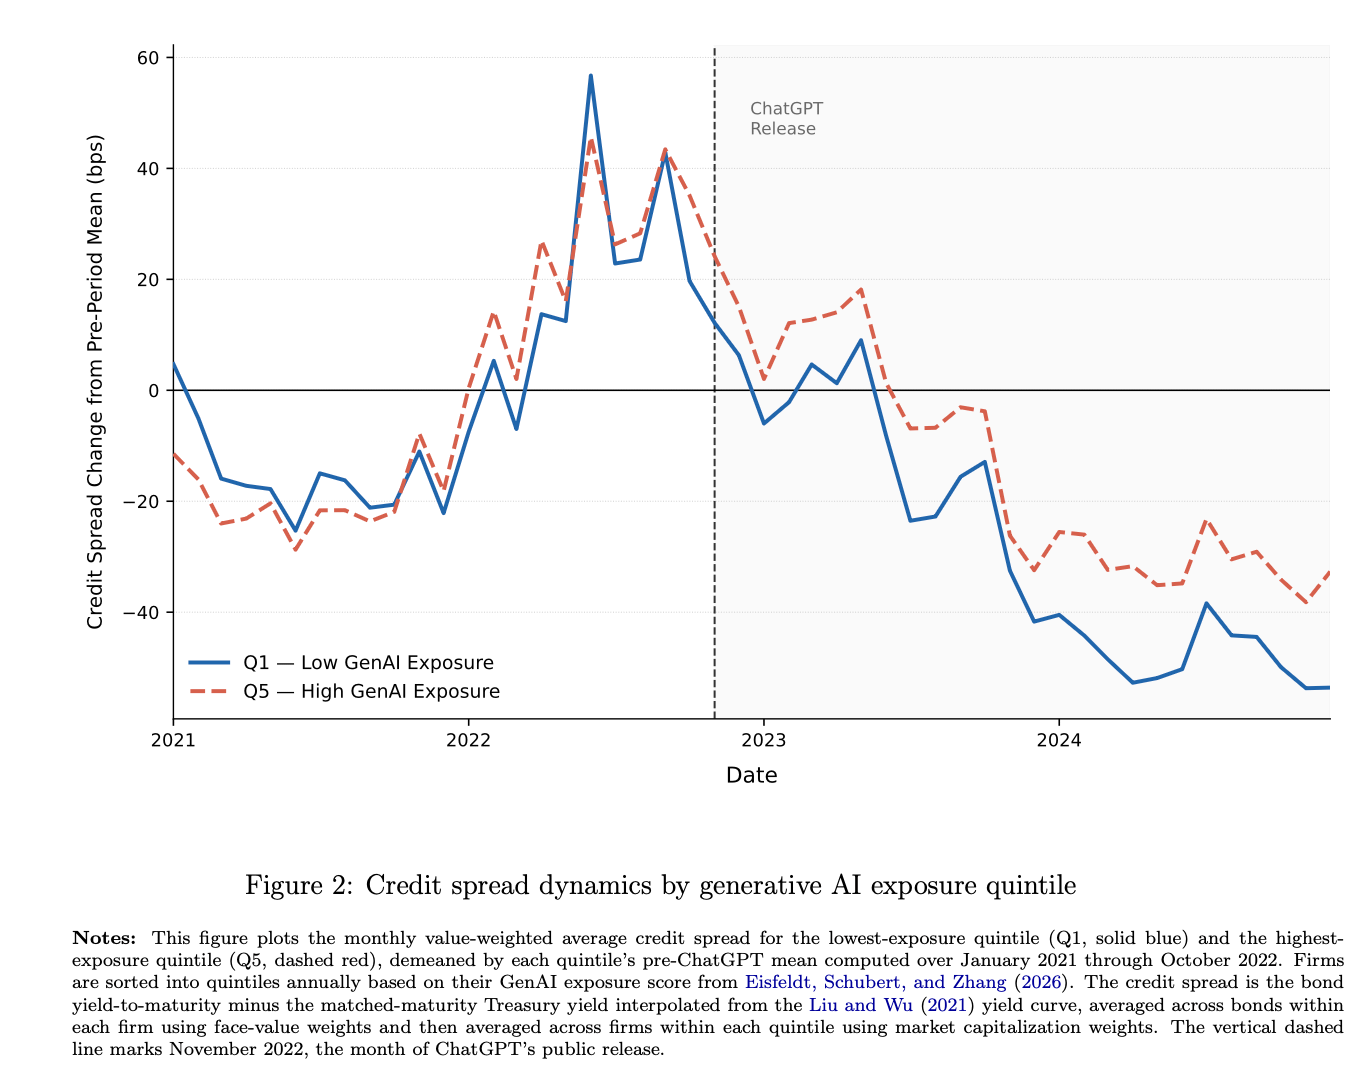
The authors confirm this pattern holds across five successive AI model launches, not just ChatGPT, and is strongest for financially fragile firms and those with weak governance. For bond investors in particular, AI exposure is not a free lunch.
Gandhi, Priyank and Lu, Juntai and Pan, Jasper and Plazzi, Alberto and Wei, Jia, Equity Prices the Opportunity, Debt Prices the Risk: Generative AI and Corporate Credit Spreads (March 31, 2026). Available at SSRN: https://ssrn.com/abstract=6503440 or http://dx.doi.org/10.2139/ssrn.6503440
This week for paid subscribers
Paid subscribers are getting a look at whether equity and debt markets price AI exposure differently and why they should. We embed a Merton structural credit model with parameter uncertainty to explain why the same generative AI shock simultaneously lifted stock valuations and widened corporate bond spreads, then test five cross-sectional predictions against 20 years of TRACE bond data. Python replication code included.

Disclaimer: The content provided in this newsletter, “Alpha in Academia,” is for informational and educational purposes only. It should not be construed as financial advice, investment recommendations, or an offer or solicitation to buy or sell any securities or financial instruments. Past performance is not indicative of future results. The financial markets involve risks, and readers should conduct their own research and consult with qualified financial advisors before making any investment decisions.
The interpretations, opinions, and analyses presented herein are those of the author and do not necessarily reflect the views of the original researchers, their institutions, or the full implications of the cited academic papers. While every effort is made to accurately represent the research discussed, readers should be aware that the summaries and interpretations may not capture the full scope or nuances of the original studies. The information contained in this newsletter is believed to be accurate and reliable at the time of publication, but accuracy and completeness cannot be guaranteed. The author and publisher accept no liability for any loss or damage resulting from reliance on the information provided.
This newsletter may contain links to external websites or resources. The author is not responsible for the content, accuracy, or reliability of these external sources.
By subscribing to or reading this newsletter, you acknowledge that you have read and understood this disclaimer and agree to hold the author and publisher harmless from any liability that may arise from your use of the information contained herein.