

A paid post, open to everyone
Many of you ask what the paid edition includes.
So I decided to make one of the more popular recent paid research posts available to everyone so you can see whether a paid subscription is for you.
If you find it valuable, the paid edition is $18 a month or $180 a year.
Hello!
On certain settlement dates, Japanese companies may need to buy dollars ahead of the 09:55 Tokyo fix. I wanted to see whether any of that shows up in USD/JPY.
The Invisible Clock of the FX Markets
The global currency market averaged $9.6 trillion a day in April 2025, according to the BIS. It is full of participants who trade for reasons other than maximizing investment return. Central banks trade to pursue policy objectives; multinational companies trade to settle overseas payments; dealers manage customer flow and risk.
This can introduce structural non-economic flow into the market. When large, price-insensitive participants transact at similar times, they may leave footprints.
One proposed calendar effect in Tokyo is called the Gotobi Anomaly. The historical test below asks whether USD/JPY tends to rise before the stated fixing window on those dates.
Where the Flow Might Come From
The word Gotobi (五十日) translates literally to “days ending in five or zero.” The article’s stated calendar rule focuses on the 5th, 10th, 15th, 20th, 25th, and the final business day of the month.
The proposed mechanism is that Japanese firms with US Dollar-denominated liabilities may need to sell Japanese Yen and buy US Dollars around these dates. If that demand is concentrated, it could create a recurring rise in USD/JPY before the fixing window.
The Fix
The hypothesis centers on the Telegraphic Transfer Middle Rate (TTM), a customer exchange-rate benchmark used by Japanese banks.
For this test, the relevant fixing boundary is assumed to be 09:55 AM Tokyo Time (JST).
The proposed sequence is simple: if banks expect customer demand for US Dollars near that boundary, they may hedge beforehand, pushing USD/JPY higher. Once the window passes, that pressure may fade. The backtest examines the price pattern; it does not observe the customer orders or bank hedges directly.
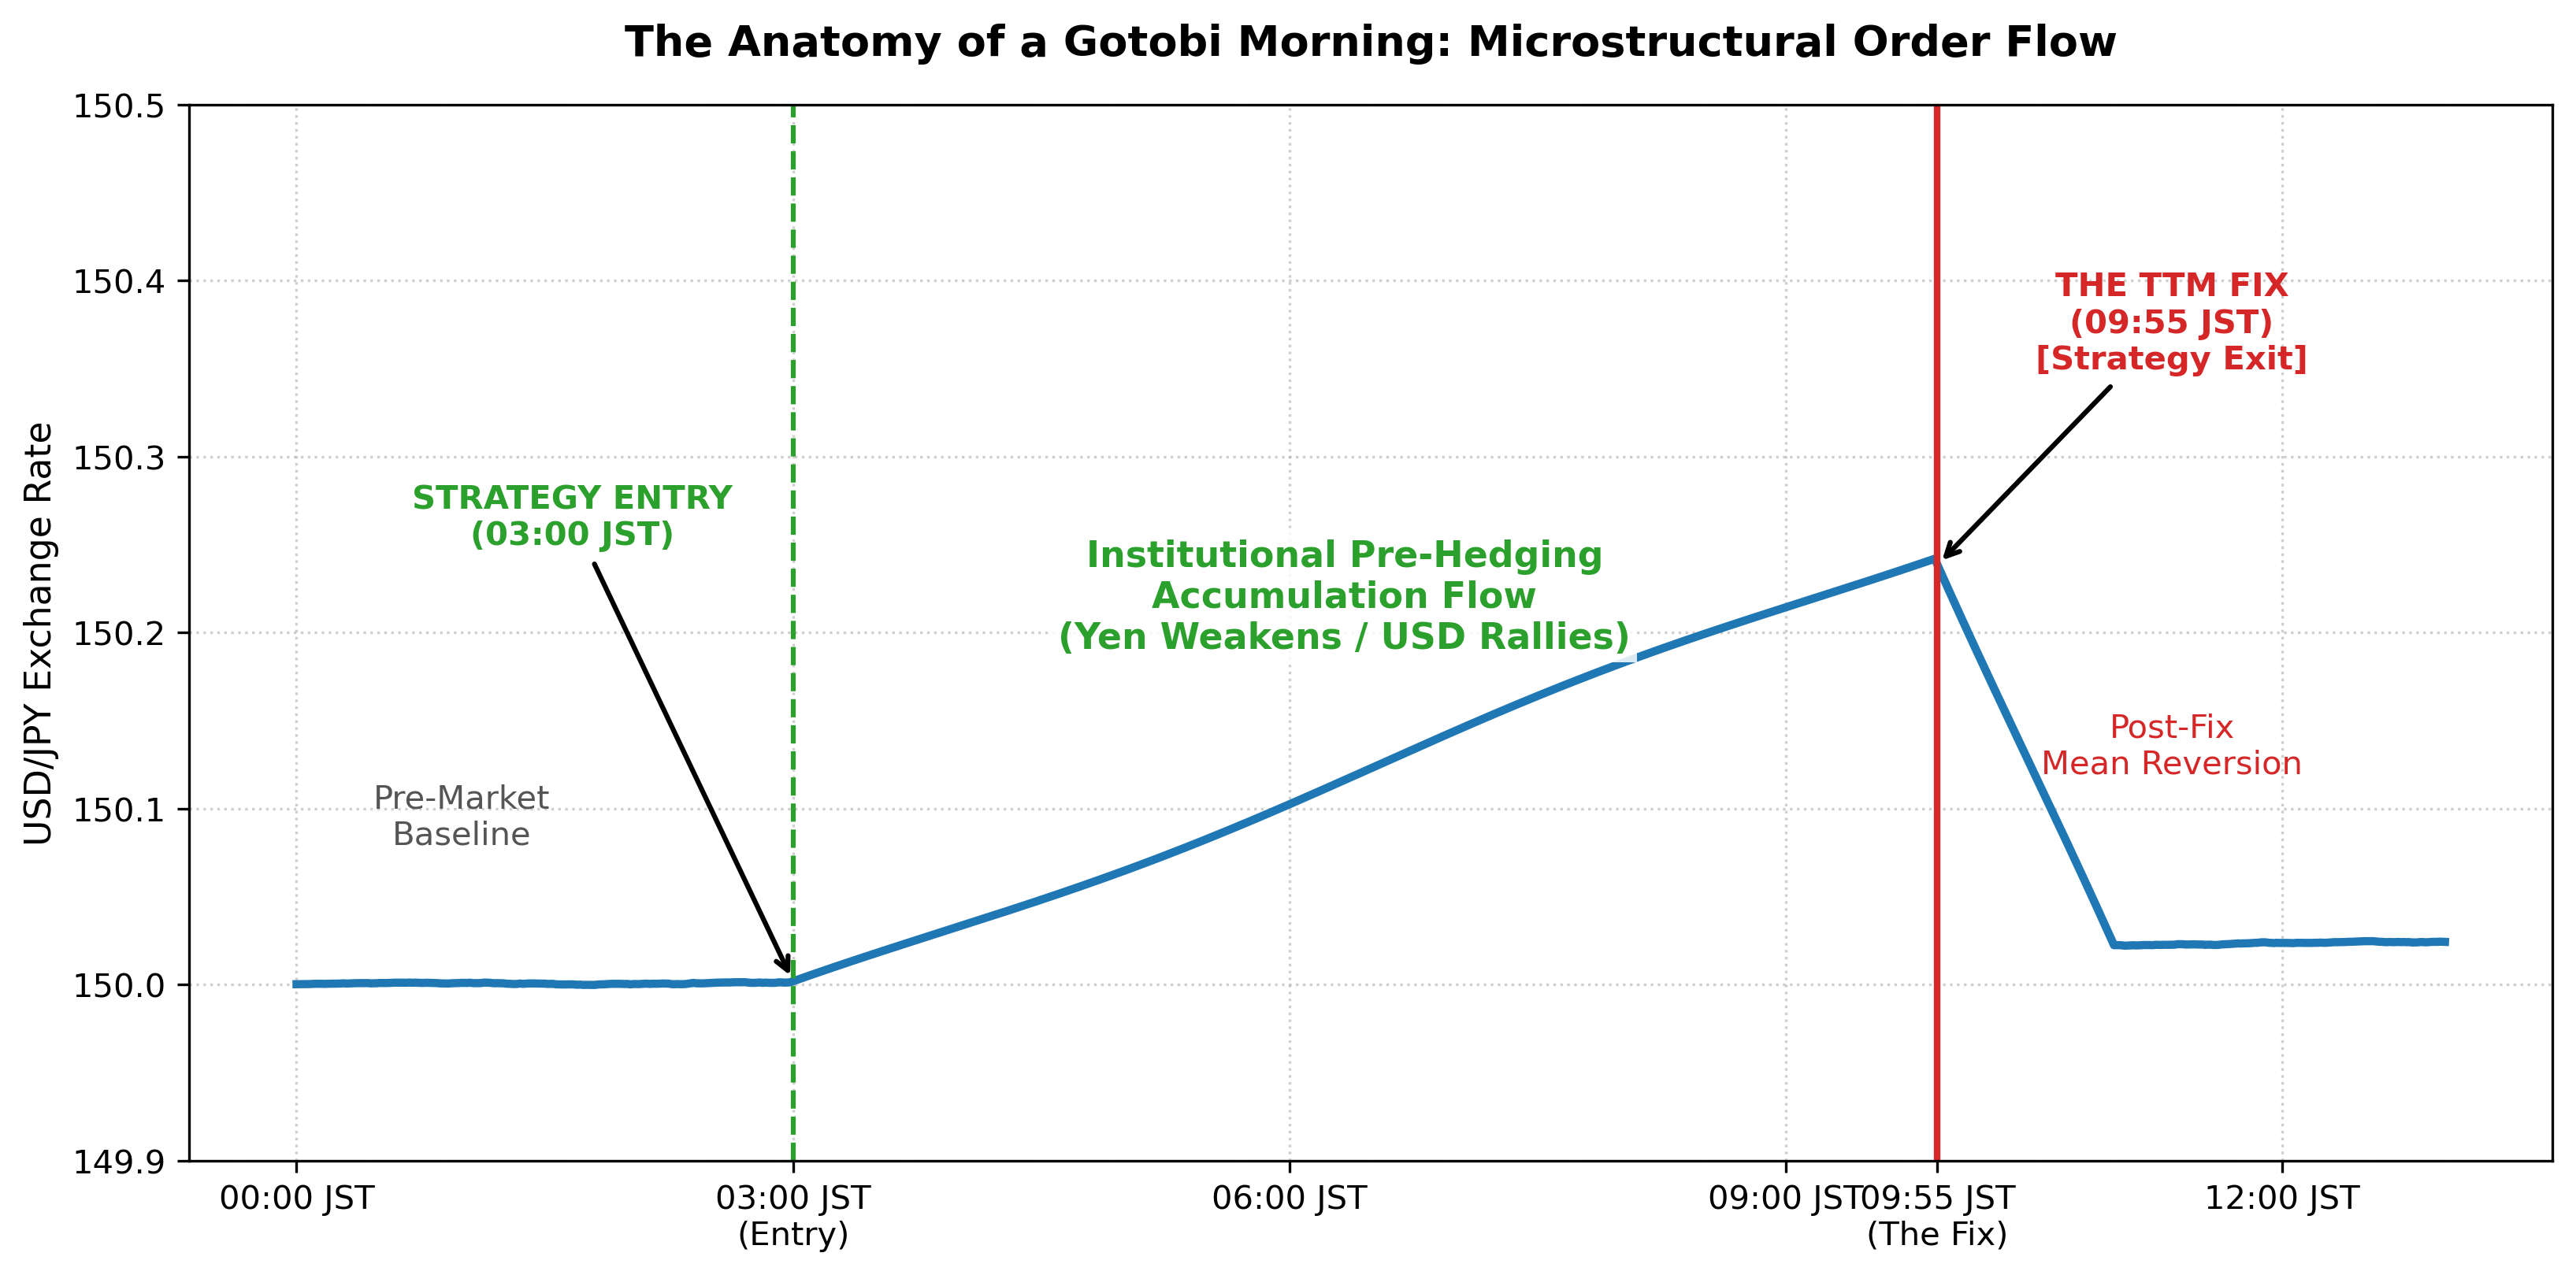
The rule is simple: buy USD/JPY at the 03:00 JST open and exit at the close of the one-minute bar timestamped 09:55 JST.
Data and Methodology
I used one-minute intraday USD/JPY data from HistData.com, January 2006 through December 2025. Under the Japanese bank-business-day calendar and boundary rules in the Research Companion, that leaves 1,175 complete execution windows.
HistData stores its historical FX files on a fixed UTC-5 clock throughout the year, without daylight-saving adjustments. That matters for a strategy built around a precise local Tokyo time.
Japan does not observe daylight saving time; Tokyo remains on UTC+9 throughout the year. Treating the HistData timestamps as DST-aware US/Eastern time would therefore shift the summer bars by an hour. The companion instead localizes them to fixed UTC-5 before converting them to Asia/Tokyo time.
Results
Over the 20-year sample span, the calendar rule yields 1,434 unique scheduled dates after rollbacks and deduplication; 1,175 contain both required boundary bars. The remaining 259 are recorded as incomplete rather than filled or inferred. This is a Japanese bank-business-day sample, with weekends, national holidays, 1–3 January, and 31 December treated as closures.
Across those 1,175 gross windows, the test generates 5,331.7 pips, 4.54 pips per trade, a profit factor of 1.62, and an event-annualized Sharpe ratio of 1.27. These figures exclude spread, commission, slippage, and financing.
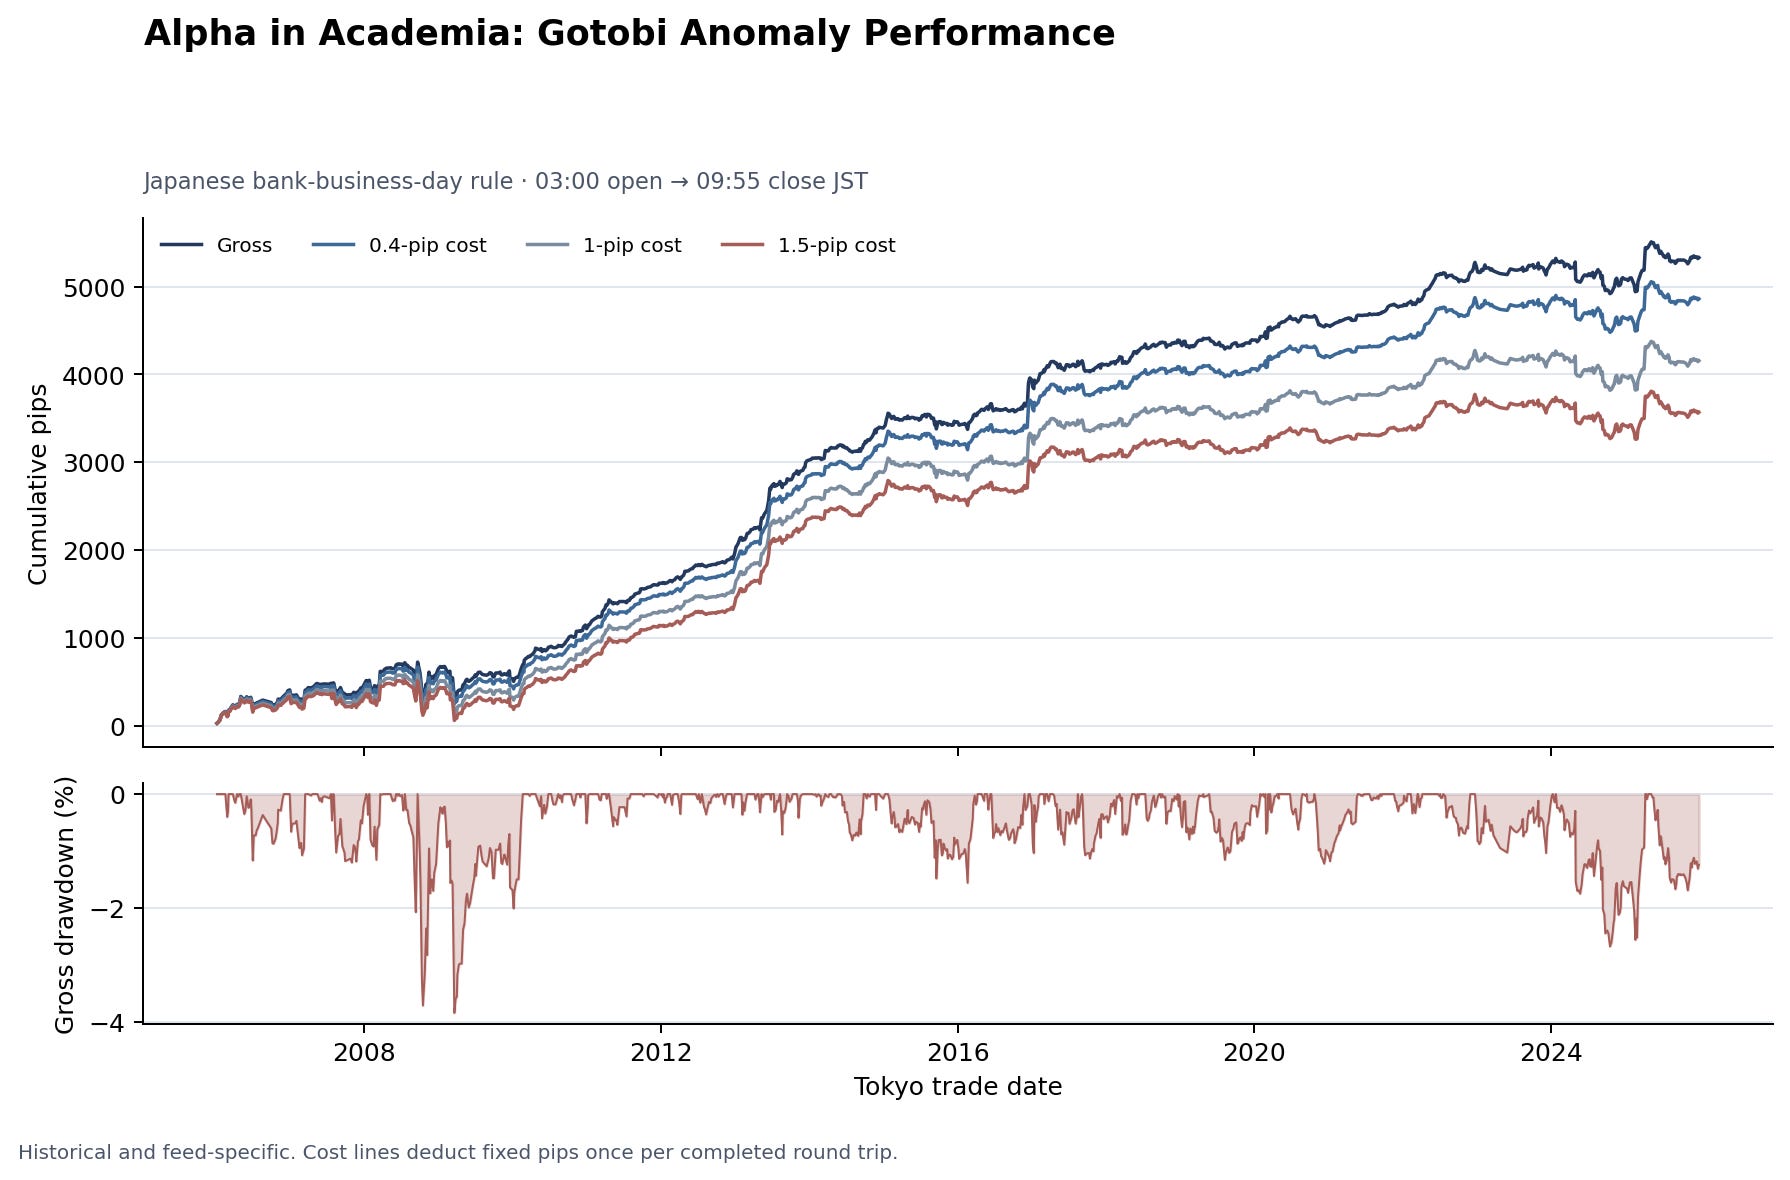
Using the 415-minute timestamp difference between 03:00 and 09:55, the 1,175 completed positions amount to about 4.6% of the continuous 20-year sample. The compounded gross-return path has a maximum drawdown of −3.85% under the stated rules.
The gross pattern wins on 61.62% of the retained windows. That consistency is compatible with the microstructural thesis, but performance from one rule and one data feed does not by itself validate the causal explanation or establish a live trading edge.
Practical Implementation & Execution Risks
While a gross event-annualized Sharpe ratio of 1.27 looks attractive on a research screen, translating these backtest metrics into a real brokerage account requires an explicit model of spread, commission, slippage, and financing.
The gross average is 4.54 pips per trade. In a simple sensitivity that subtracts a fixed round-trip cost, 0.4 pips lowers the average to 4.14 pips, the profit factor to 1.55, and the event-annualized Sharpe ratio to 1.17. At 1.0 pip, those figures fall to 3.54, 1.46, and 1.01; at 1.5 pips, to 3.04, 1.38, and 0.88. This is only a cost sensitivity: the test still does not model actual commissions, slippage, or financing.
The code exits at the close of the timestamp-labeled 09:55 AM bar. The one-minute data alone do not establish that this close is the fixing instant or the last print before 10:00. The boundary choice matters: the gross average is 5.08 pips at the 09:55 bar open, 4.54 pips at its close, and 4.20 pips at the close of the 09:59 bar.
Furthermore, the entry boundary is 03:00 AM JST, six hours before 09:00 and nearly seven hours before the stated fixing boundary. Feed continuity and spreads at that hour matter, but the test does not model them.
What I’m left with is a gross pattern under an explicit business-day rule. Whether it is still there, and whether it is executable, are separate questions. The bar convention matters, and so do spreads, slippage, commissions and financing.
Conclusion
Across 1,175 complete windows from 2006 to 2025, the average change from the 03:00 JST open to the 09:55 JST bar close was +4.54 pips. It remained positive after fixed round-trip deductions of 0.4, 1.0 and 1.5 pips.
What I still cannot see is whether Gotobi is doing the work. I have prices, not the customer orders or bank hedges behind them, and I have not run the same window on non-Gotobi mornings. That is the obvious next test. If the move is weaker there, I would take the settlement explanation more seriously. If it looks about the same, this is probably a Tokyo-morning pattern rather than a Gotobi one.
Research companion
The companion includes the tested implementation, method notes, fixed dependencies, synthetic tests, and reference outputs. Supply your own HistData files; the package contains no market data.
Version 1.0.3 · Tested with Python 3.12 · 8 GB RAM recommended
If you would like more research like this
Paid subscribers receive a new investigation every Thursday and have access to the complete archive of 50+ investigations and all available research companions. The paid edition is $18 a month or $180 a year.
If you would like to keep reading and support my work, subscribe below.
Revision note — 27 July 2026: I implemented the calendar as Japanese bank business days, corrected the historical results and chart, clarified the exposure measure and bar timing, and added the research companion. The evidence still supports a positive gross pattern, but not the proposed cause or a live trading edge.
Sources
Source: HistData.com, USD/JPY one-minute historical data, 2006–2025.
Source: Bank for International Settlements, 2025 Triennial Central Bank Survey, foreign exchange turnover in April 2025.
Disclaimer
The content provided in this newsletter, “Alpha in Academia,” is for informational and educational purposes only. It should not be construed as financial advice, investment recommendations, or an offer or solicitation to buy or sell any securities or financial instruments. Past performance is not indicative of future results. The financial markets involve risks, and readers should conduct their own research and consult with qualified financial advisors before making any investment decisions.
The interpretations, opinions, and analyses presented herein are those of the author and do not necessarily reflect the views of the original researchers, their institutions, or the full implications of the cited academic papers. While every effort is made to accurately represent the research discussed, readers should be aware that the summaries and interpretations may not capture the full scope or nuances of the original studies. The information contained in this newsletter is believed to be accurate and reliable at the time of publication, but accuracy and completeness cannot be guaranteed. The author and publisher accept no liability for any loss or damage resulting from reliance on the information provided.
This newsletter may contain links to external websites or resources. The author is not responsible for the content, accuracy, or reliability of these external sources.
By subscribing to or reading this newsletter, you acknowledge that you have read and understood this disclaimer and agree to hold the author and publisher harmless from any liability that may arise from your use of the information contained herein.