

Welcome back to another issue of Recent Academic Research!
Let’s get into it.
Pricing American Options Beyond Heston
A fast spectral method for pricing American options now works across the stochastic-volatility models that actually fit equity markets, not just Heston.
Pricing American options under stochastic volatility is usually a slow finite-difference grind, and the fast Fourier-based shortcuts have historically only worked for the Heston model because it has a clean closed-form characteristic function. This paper extends the damped-sinc (DSINC) method to the stochastic-volatility models that empirical studies actually prefer, including the 3/2 model, SABR, GARCH diffusion, and lognormal volatility. The core finding is that the spectral collapse identity (the trick that reduces the early-exercise integral to one Fourier integral) still holds without the affine structure, provided damping sits in a well-defined strip.
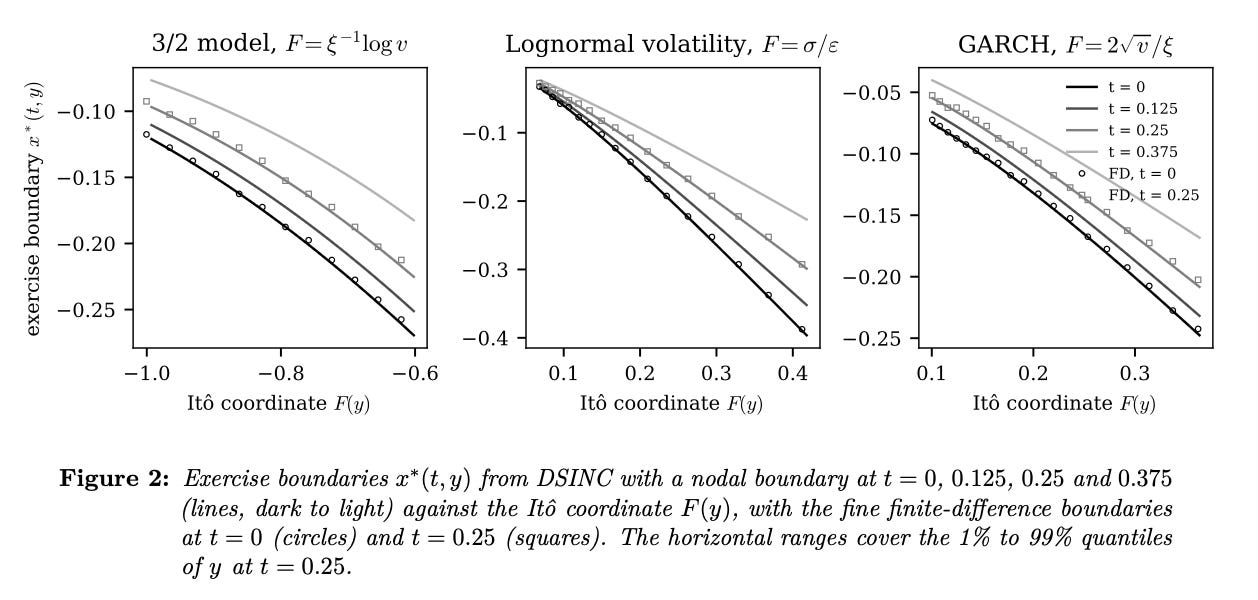
For correlated SABR, a change of volatility coordinate avoids the usual coupling headache. Accuracy lands within one basis point of fine finite-difference benchmarks at comparable or lower cost. For practitioners, this means desks modeling realized variance, VIX products, or FX smiles can price American exercise using the models that fit the data, not just the one that fits the math.
Itkin, Andrey, DSINC Beyond Heston: The 3/2 and Other Non-affine Stochastic-Volatility Models (October 20, 2026). Available at SSRN: https://ssrn.com/abstract=7653118 or http://dx.doi.org/10.2139/ssrn.7653118
Turning SHAP Explanations Into Better Portfolios
Feature attribution in machine-learning portfolios can do more than explain, it can actually improve out-of-sample net Sharpe ratios without retraining the model.
Most machine-learning explainability tools tell you which features drove a model’s output, but that’s not the same as knowing which features actually improved your portfolio. This paper builds a framework that traces a feature’s influence all the way from allocation weights through turnover, volatility, and finally the net Sharpe ratio. The key insight is that a feature can be critical for setting positions yet destructive for performance once transaction costs enter the picture, and separating those channels matters.
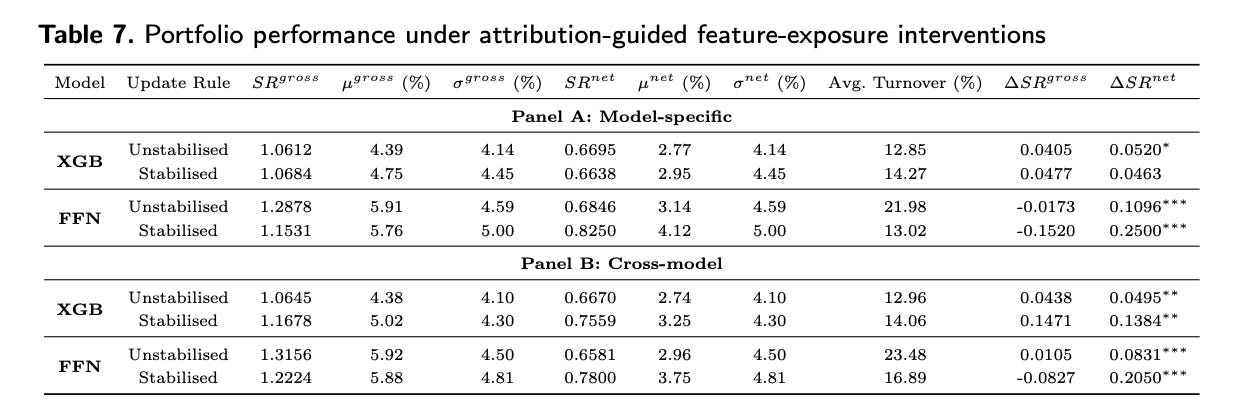
Using a statistical arbitrage setup on U.S. equities from 2006 to 2024, the authors show that feeding attribution signals back into feature exposure (without retraining the model) lifts the FFN net Sharpe from 0.58 to 0.83, mostly by cutting turnover roughly in half. For XGB, averaging attributions across models raises the net Sharpe from 0.62 to 0.76 via better gross performance. For investors, this reframes explainability as a usable alpha-preservation tool rather than a diagnostic afterthought.
Liang, Yunqi and Zohren, Stefan and Cucuringu, Mihai, From Economic Explanation to Performance Improvement in Machine-Learning Portfolios (September 01, 2026). Available at SSRN: https://ssrn.com/abstract=7671079 or http://dx.doi.org/10.2139/ssrn.7671079
When Do Earnings Prediction Markets Actually Beat the Analysts?
Earnings prediction markets add forecasting value in combination with analyst estimates about five days before announcements, but only beat them outright in the final day.
Polymarket’s earnings contracts, which pay a dollar if a firm beats consensus EPS, have been hailed as more accurate than Wall Street analysts. Zhang pushes back on that framing by asking a sharper question: when do these prices actually add information beyond what we already get from a firm’s beat history and the analyst consensus? Evaluated prospectively (fitting weights in one earnings season, testing in the next), contract prices start adding value in combination with existing forecasts about five days before the announcement, but only outperform those benchmarks on their own in the final day of trading.
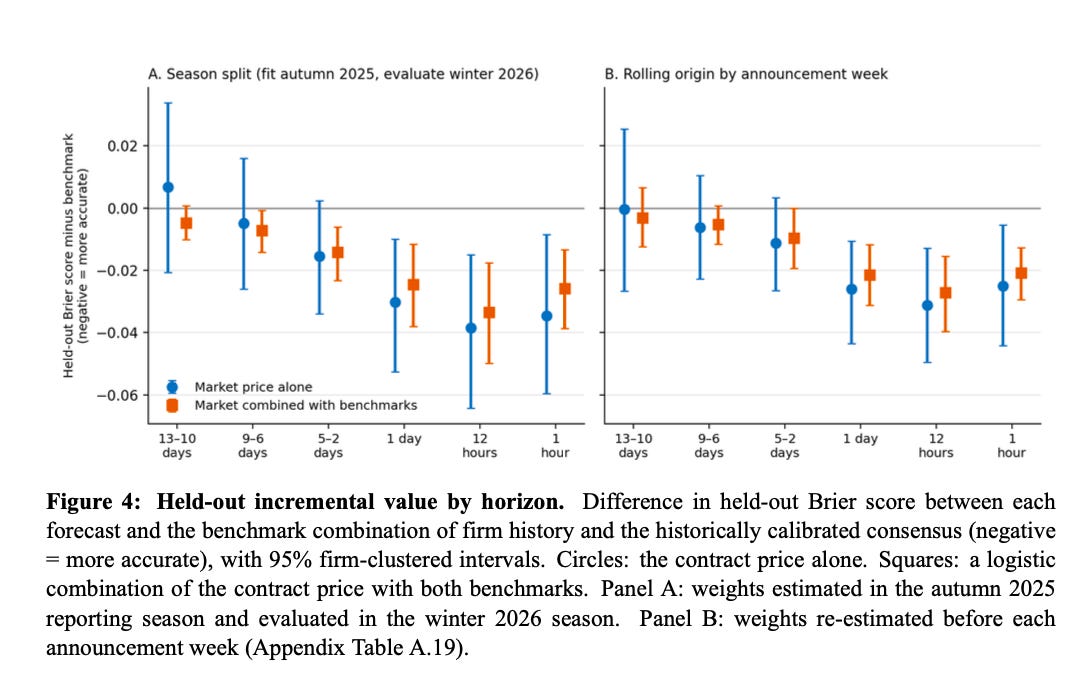
The market’s edge seems to come from incorporating public news (like peer firms’ earnings surprises) that stale analyst estimates have not yet absorbed, not from a hidden group of informed traders. For investors, the practical takeaway is that these contracts complement traditional forecasts rather than replace them, and the stock market has largely priced in their signal before the bell rings.
Zhang, Tengfei, What do Earnings Prediction Markets Know? (October 24, 2026). Available at SSRN: https://ssrn.com/abstract=7667338 or http://dx.doi.org/10.2139/ssrn.7667338
Where Are the Dealers? Inside China’s Corporate Bond Market
China’s $5 trillion corporate bond market runs without the dealer core that defines Western OTC markets, and the reasons trace back to bank incentives.
Using a Chinese counterpart to TRACE, the authors deliver the first trade-level look at the world’s second-largest corporate bond market, and what they find breaks the standard OTC playbook. There is no dealer-dominated core-periphery network. Designated dealers (mostly banks) supply only about a quarter of liquidity, and customers trade directly with each other for most of the market’s volume.
When customers step in as backup liquidity providers, there is a trade-off: long-term holders like insurers provide persistent but expensive liquidity, while trading-oriented players offer tighter execution but disappear quickly. Two frictions explain the dealer gap. Smaller banks are hemmed in by capital constraints, while the Big Six state-owned banks concentrate on central SOE bonds and pull back from market making when lending margins rise, because safe SOE loans are simply more profitable. For investors, this means Chinese bond liquidity is thinner, costlier, and more fragile than headline market size suggests.
Du, Linlin and Hu, Yue and Song, Yang and Wu, Wenfeng, China’s Corporate Bond Market: A Transaction-level Analysis (September 01, 2025). Available at SSRN: https://ssrn.com/abstract=5963114 or http://dx.doi.org/10.2139/ssrn.5963114
This week for paid subscribers
Paid subscribers are getting a full deep dive of the covered-call options strategy, reproduced on its original historical window and extended through August 2025 on the authors’ exact specification, against survival thresholds fixed before out-of-sample tests were observed. The post traces how the classic volatility risk premium leg in S&P 500 and Nasdaq-100 ran hot into the end of the paper sample and turned into a post-paper point estimate near zero, and tests whether duration approximation noise, execution drag, or a structural break in volatility spikes is actually behind it. Python notebook and data included.

Disclaimer: The content provided in this newsletter, “Alpha in Academia,” is for informational and educational purposes only. It should not be construed as financial advice, investment recommendations, or an offer or solicitation to buy or sell any securities or financial instruments. Past performance is not indicative of future results. The financial markets involve risks, and readers should conduct their own research and consult with qualified financial advisors before making any investment decisions.
The interpretations, opinions, and analyses presented herein are those of the author and do not necessarily reflect the views of the original researchers, their institutions, or the full implications of the cited academic papers. While every effort is made to accurately represent the research discussed, readers should be aware that the summaries and interpretations may not capture the full scope or nuances of the original studies. The information contained in this newsletter is believed to be accurate and reliable at the time of publication, but accuracy and completeness cannot be guaranteed. The author and publisher accept no liability for any loss or damage resulting from reliance on the information provided.
This newsletter may contain links to external websites or resources. The author is not responsible for the content, accuracy, or reliability of these external sources.
By subscribing to or reading this newsletter, you acknowledge that you have read and understood this disclaimer and agree to hold the author and publisher harmless from any liability that may arise from your use of the information contained herein.