

Hello and welcome back to another paid post!
Today we are looking at covered calls, the strategy behind the income ETFs that have become a staple of retail portfolios. Israelov and Nielsen showed in 2015 that a covered call is really three trades: a position in the index, a bet that the market will move less than option prices imply, and a timing bet that comes attached to the option. Rebuilding their split on thirty years of option data, the timing bet carries a third of the risk and is not paid, and the volatility leg, the one part sellers are actually compensated for, has mostly stopped paying since the paper was published.
Let’s dive right in.
Introduction
The covered call is the first option strategy most people learn. You own the index, sell a call against it every month, and keep the premium. The usual pitch is that you trade some upside for income and a smoother ride. Funds like XYLD and QYLD package exactly this: each month they sell an at-the-money one-month call on the S&P 500 or the Nasdaq-100 and pay most of the premium out as a distribution. Yields of 7% to 12% a year are the whole appeal.
The standard way to think about the trade is as one position with a capped upside. Israelov and Nielsen made the case in the Financial Analysts Journal in 2015 that this hides three separate exposures.
The first is passive equity. On average you hold about half the index, because a short at-the-money call offsets about half of your stock.
The second is short volatility. Strip out the call’s stock exposure and what is left is a bet that the index will move less than option prices imply. Option sellers have historically been paid for taking that bet, which is the volatility risk premium.
The third is equity timing, and it is the one nobody chose. A call’s delta moves with the market. After a rally the call you sold is deep in the money, it moves almost one for one with the index, and your net stock exposure shrinks toward zero. After a sell-off the call is nearly worthless and you are back to holding almost the full index. The position mechanically sells after gains and buys after losses, which is a bet that moves reverse.
Israelov and Nielsen found that the short volatility leg earned a Sharpe ratio of nearly 1.0 while contributing about 10% of the risk, and that the timing leg contributed about 25% of the risk for very little return. Israelov, Klein and Tummala later ran the same split on eleven global indexes and found the timing returns statistically insignificant in every one.
The original sample ends in 2014. Since then covered-call ETFs have gone from a niche to a fixture of income portfolios. So the questions here are simple: Does the split still hold on another decade of data? And what does it say about the funds people actually hold?
Data and Methodology
Option prices and Greeks come from OptionMetrics via WRDS: daily quotes, implied volatilities and deltas for S&P 500 (SPX) and Nasdaq-100 (NDX) index options, January 1996 to 29 August 2025. The Nasdaq-100 sample starts in 2001, because before then OptionMetrics has no index opens for NDX and the option chain was thin enough that the nearest strike above spot was sometimes 8% out of the money. Dividends come from the S&P 500 total return index and, for the Nasdaq-100, from QQQ’s distributions. The cash rate is the 13-week T-bill yield. Cboe’s published BXM and BXN histories serve as the benchmark, and fund prices are from Yahoo.
The construction follows Cboe’s buy-write rules. On each monthly expiration (the third Friday), sell the next month’s call at the smallest listed strike at or above the index, and hold it to expiry. That gives 355 monthly rolls on the S&P 500 and 295 on the Nasdaq-100, with the written strike a median 0.15% above spot.
Three construction choices are worth stating plainly:
Cboe writes the new call at the average traded price between 11:00 and 11:30 on roll day, and settles the old one at a special opening quotation. I only have end-of-day data, so I write at the close and settle at the index open.
The call is sold at the bid and marked at the mid afterwards. The gap between the two is booked as its own line, execution, so that the volatility leg measures the premium rather than the cost of collecting it. Checking the rebuild against Cboe shows why the bid is the right assumption.
OptionMetrics leaves out deltas when it cannot fit an implied volatility, which happens almost entirely on the last trading day before expiry. On the S&P 500 that is 514 of 7,442 days. I fill them with a Black-Scholes delta from the call’s last good implied volatility; on days where both exist, the two differ by a median of 0.012.
The decomposition itself is an accounting identity. Each day, with S the index, C the call, Δ its delta and dS the index’s total-return move in points:
The equity weight w is the share of the portfolio effectively invested in the index. Its average is 47% on both indexes. Passive equity is that average weight times the index return; timing is the daily deviation from it. Everything is measured in excess of T-bills, and the pieces add back to the total to the sixteenth decimal place.
Before splitting anything, the rebuild has to match the indexes it claims to be. Monthly returns correlate 0.98 with Cboe’s BXM and 0.99 with BXN. Writing at the bid rather than the mid is what makes the levels line up: BXN then runs within 0.03 percentage points a year of Cboe after 2012, and BXM within 0.47. Regressing each roll’s remaining gap on its likely causes says why. The coefficient on half the bid-ask spread is 3.1 (t=2.09), so the trades Cboe records between 11:00 and 11:30 print well below the closing mid. Settling at the open rather than at Cboe’s opening quotation adds a small upward bias when the old call expires in the money (t=3.59). Neither touches the daily deltas or marks the decomposition is built from, so I take the rebuild as it stands and disclose the gap.
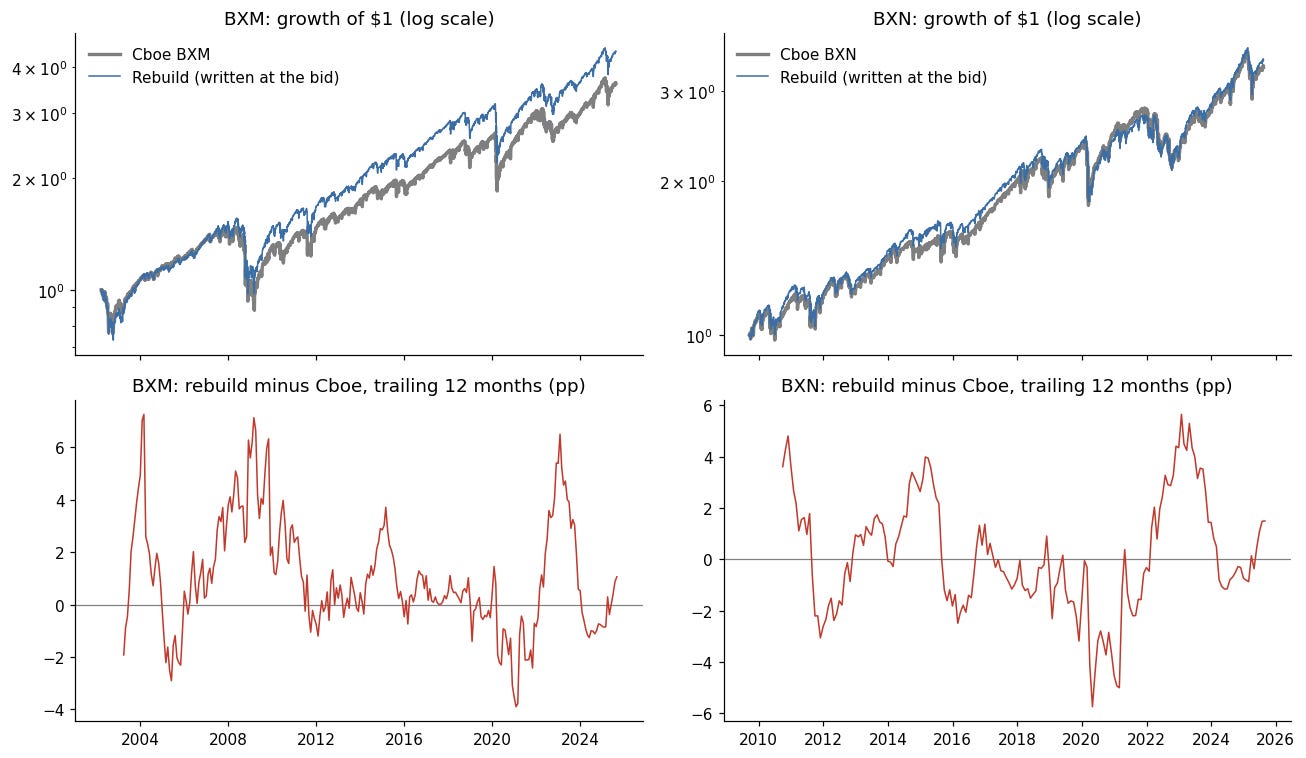
Figure 1: The rebuild against Cboe’s published indexes, written at the bid. The shapes are the same index; the remaining BXM level gap is concentrated before 2012, when option spreads were several times wider than they are today.