

Welcome back to another issue of Recent Academic Research!
Let’s get into it.
Fair-Weather Liquidity: When HFT Helps Corporate Bond Investors, and When It Runs
High-frequency traders tighten corporate bond spreads in calm markets and then vanish exactly when funds need them most.
Using two decades of TRACE, CRSP, and TAQ data covering 712 mutual funds and roughly 14 million bond trades, this paper maps how algorithmic trading and portfolio illiquidity jointly drive corporate bond fragility. The headline finding is a clean split by regime. In normal conditions, HFT activity compresses bid-ask spreads, improves price efficiency, and even buffers funds against flow-induced volatility. But during the 2008 crisis, the 2013 Taper Tantrum, and the March 2020 dash-for-cash, HFT participants withdraw sharply, and spreads widen fastest for the very bonds that had benefited most from their presence.
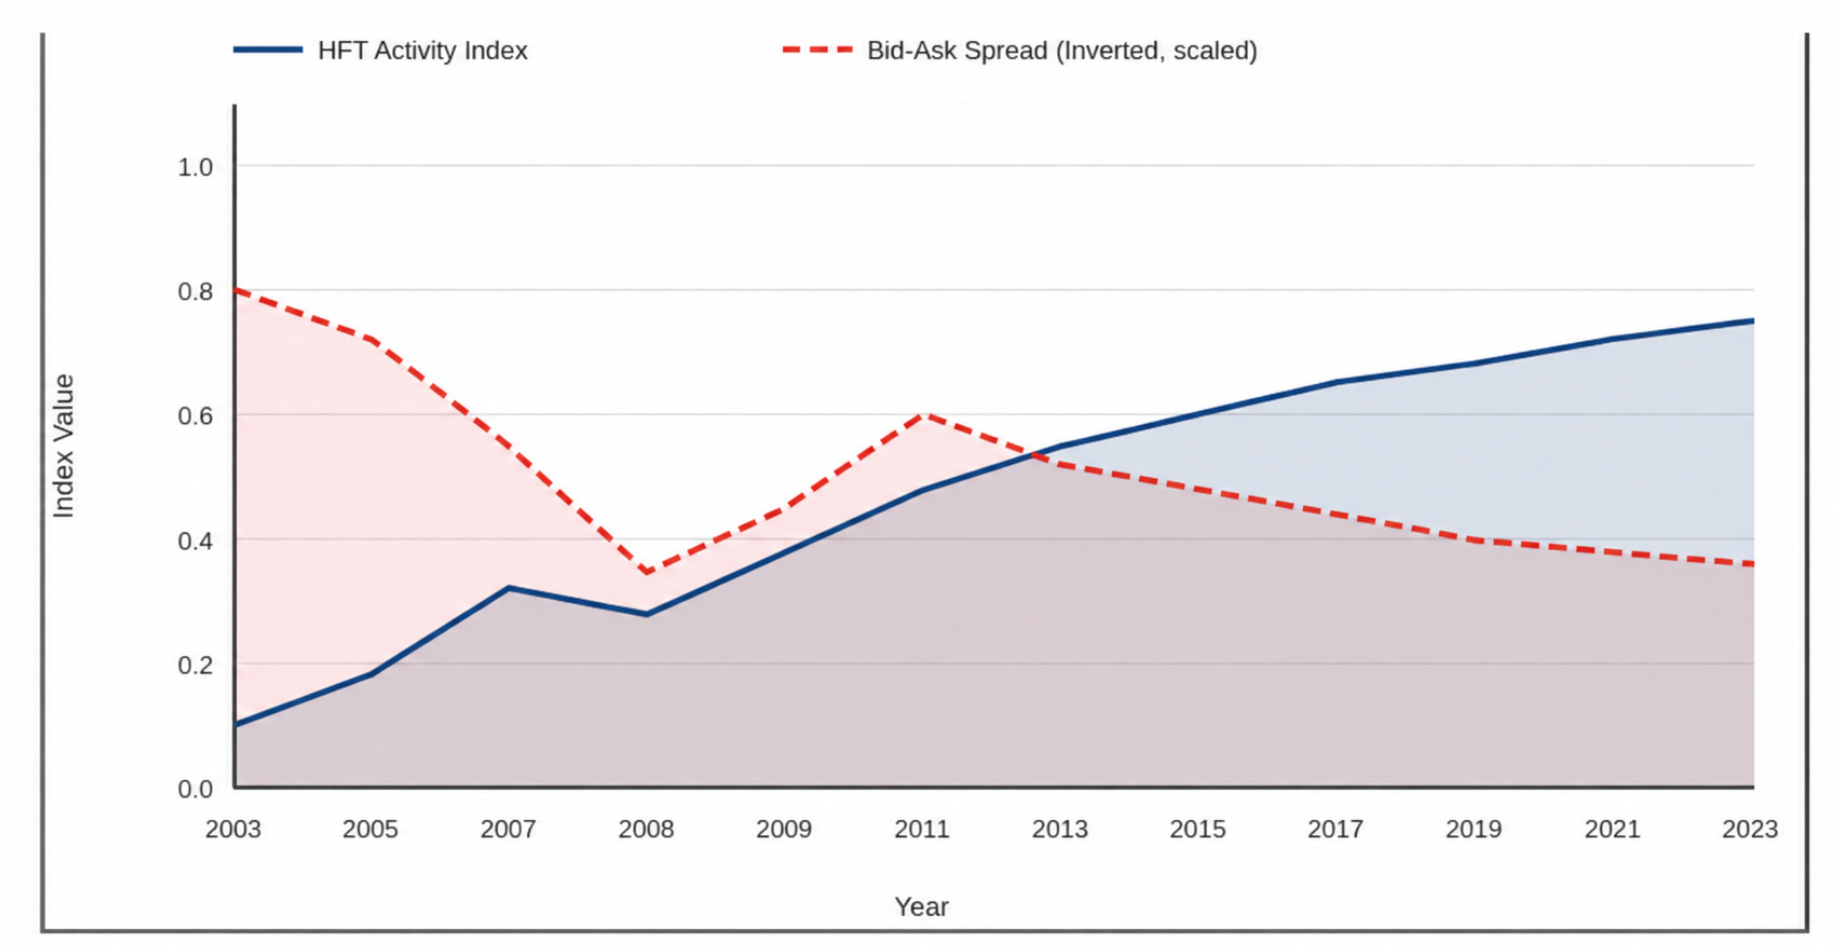
Figure 2. HFT Activity Index and Corporate Bond Bid-Ask Spread (2003–2023). Quarterly averages of the fund portfolio-weighted HFT intensity index (solid blue area) and bid-ask spread in basis points, inverted and scaled for comparability (dashed red area). HFT intensity is standardized. Bid-ask spread is the portfolio-weighted average of bond-level estimates from TRACE Enhanced.
Layered on top, funds holding more illiquid portfolios show much steeper flow-performance concavity, meaning investors redeem harder on bad returns, and this asymmetry is significantly stronger in low-rate environments where investors have fewer income alternatives. Funds with more illiquid holdings do earn higher alphas in calm periods (consistent with a liquidity premium) but suffer larger drawdowns when HFT retreats. For bond fund investors, the practical takeaway is that headline liquidity metrics look best precisely when they matter least.
Zhao, Yichang and Yang, Liu, Market Liquidity, High-Frequency Trading, and Corporate Bond Pricing: Evidence from U.S. Mutual Fund Flows and Volatility Dynamics. Available at SSRN: https://ssrn.com/abstract=7412644 or http://dx.doi.org/10.2139/ssrn.7412644
The Portfolio Optimization Problem Everyone Skips: Choosing the Information Itself
Treating your choice of inputs as a decision, not an assumption, exposes two silent errors that make backtests lie and diversification break.
Standard mean-variance optimization takes the inputs (expected returns, covariances, the signals feeding them) as given and just picks weights. This paper argues that’s where most of the damage happens, because two errors sneak in unnoticed: using data that wouldn’t actually have been available at decision time (look-ahead), and treating shared drivers of risk as if each asset moved on its own. The author reframes the problem as a two-stage decision, first selecting an admissible information set (chronologically valid, arbitrage-preserving, and statistically able to separate common from idiosyncratic risk), then running the classical optimizer inside it. Tested on twelve US equities against 127 macro and financial drivers, the framework meets its separation condition on individual stocks but fails on pre-sorted portfolios (industry, size, value), because the residual dependence there is the common factor itself.
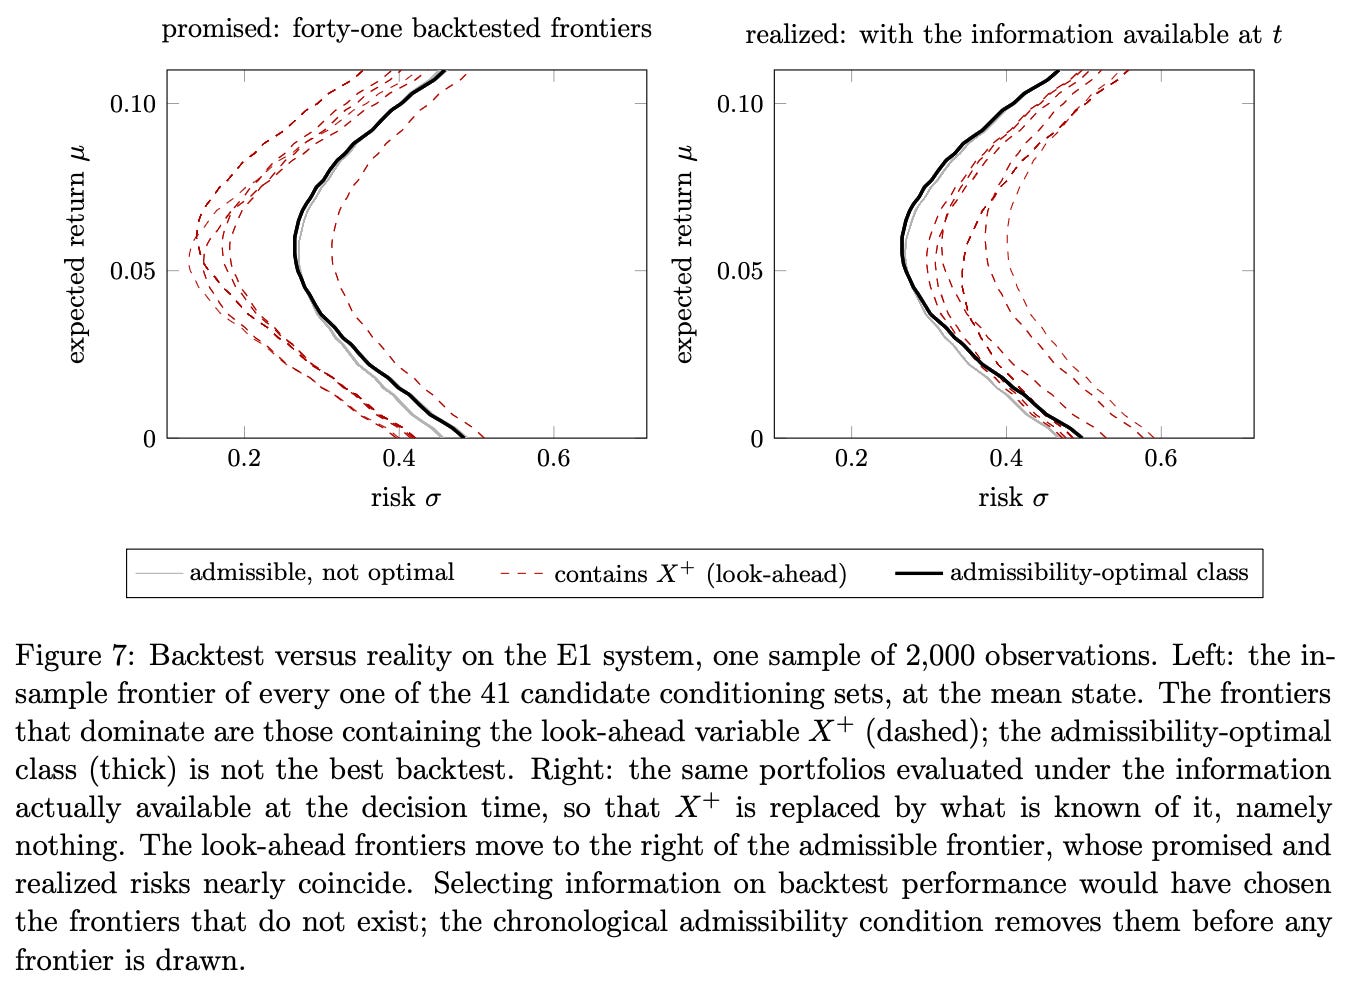
Even when the condition fails, the resulting minimum-variance portfolios match Ledoit-Wolf shrinkage on volatility at roughly a third less turnover, though reported risk is understated by around 15 percent. The message for anyone building factor or multi-asset portfolios: the covariance matrix you trust is only as honest as the information set you never audited.
Rodriguez Dominguez, Alejandro, Admissible Portfolio Optimization: Information Constraints, Conditional Efficient Frontiers, and the Price of Causal Identification (September 15, 2026). Available at SSRN: https://ssrn.com/abstract=7468398 or http://dx.doi.org/10.2139/ssrn.7468398
A Reliability-Aware Approach to Crypto Portfolio Optimization
Weighting expert forecasts by how reliable they actually are can completely reshape which crypto assets end up in your portfolio, not just tweak the weights.
Most quantitative portfolio models treat every expert return forecast as equally credible, which is a strong assumption when the inputs come from analysts with wildly different track records. This paper builds a framework using Z-numbers (a construction from fuzzy set theory that pairs each forecast with a reliability score) and plugs it into standard credibilistic VaR and CVaR optimization. The authors test it on 46 cryptocurrencies across 27 scenarios spanning different return targets, portfolio sizes, and allocation constraints. The headline result is that reliability weighting is not a marginal adjustment. In one representative scenario, the standard model concentrates in BNB, BTC, and MNT, while the reliability-aware version holds CRO, NEAR, and SEI, sharing zero assets in common.
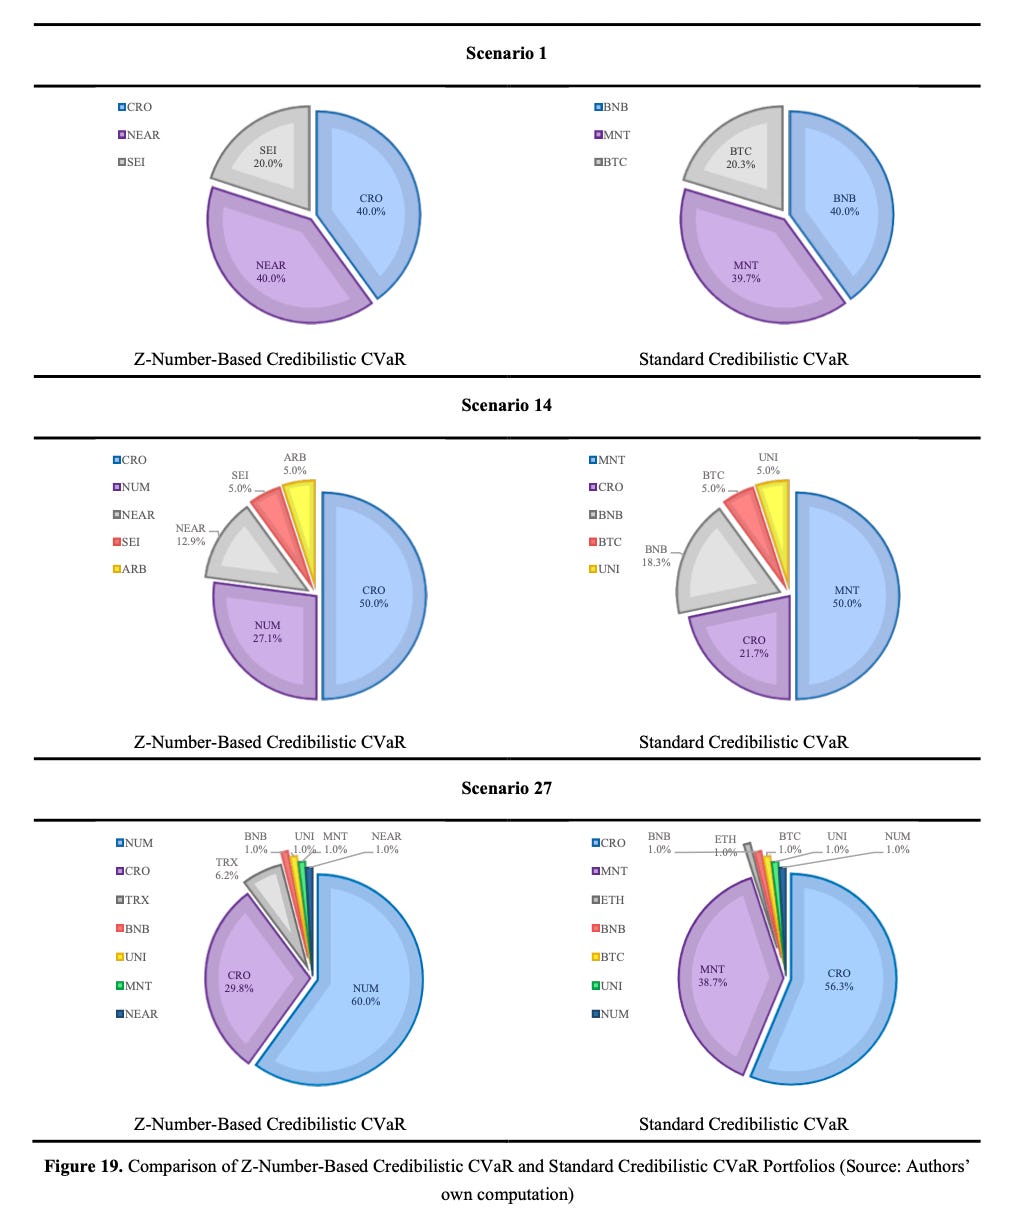
A sensitivity analysis shows the framework responds cleanly to shifts in reliability inputs, which also means sloppy reliability estimates will push you into a bad portfolio just as surely as ignoring reliability entirely. For anyone building crypto allocations off analyst forecasts or model outputs of varying quality, the takeaway is that treating information quality as a first-class input, not an afterthought, materially changes what you own.
Ghanbari, Hossein and Mohammadi, Emran and Sadjadi, Seyed Jafar and Kumar, Ronald and Stauvermann, Peter J., A Novel Framework for Considering the Experts’ Reliability in Portfolio Optimization under Partial Information: Incorporating Z-numbers into Credibilistic Quantile-Based Risk Measures(September 06, 2026). Available at SSRN: https://ssrn.com/abstract=7424938 or http://dx.doi.org/10.2139/ssrn.7424938
How SLR Constraints Broke the Treasury Market in March 2020
When leverage rules bite, primary dealers dump Treasuries at fire-sale prices, and the whole market feels it.
During the March 2020 dash-for-cash, primary dealers were supposed to absorb a tidal wave of Treasury selling, but a quiet regulatory constraint got in the way. This HKIMR study uses transaction-level data from the Fed’s emergency purchase program to show that bank-affiliated dealers running low on Supplementary Leverage Ratio headroom sold Treasuries to the Fed at meaningfully lower prices than their less constrained peers. For 30-year bonds, dealers with one percentage point less SLR headroom accepted roughly 46 basis points lower prices, a sizable haircut when bid-ask spreads were already blown out.
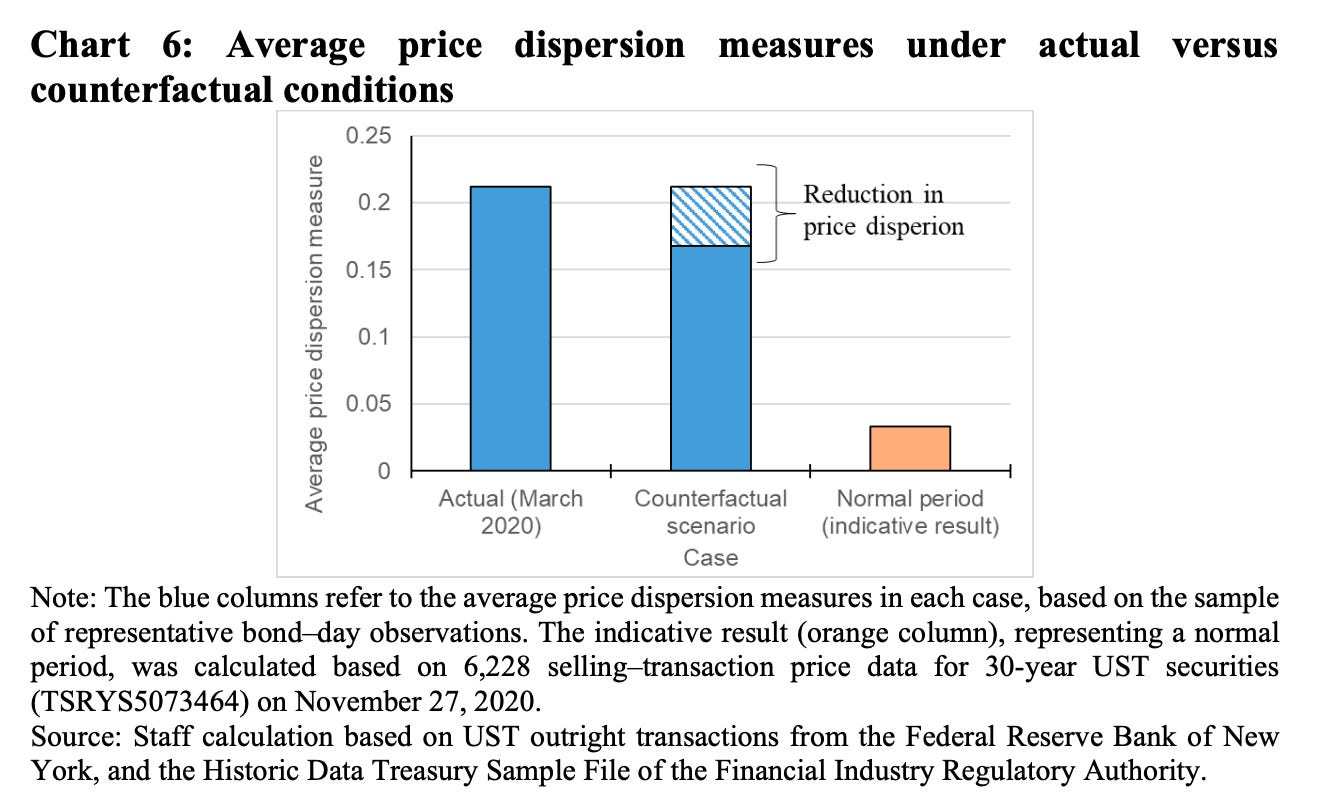
The authors then run a counterfactual, asking what would have happened if the Fed’s recently proposed SLR reform (which would have added about 120 bps of headroom on average) had been in place. Price dispersion, a clean proxy for illiquidity, drops by roughly 20 percent, though it still sits well above normal levels. The takeaway for investors is that capital rules quietly shape who can warehouse risk in a crisis, and dealer balance sheet constraints can turn a liquidity event into a price dislocation.
Institute for Monetary and Financial Research, Hong Kong, Assessing the Impact of Supplementary Leverage Ratio Requirements on the Market-Making Behaviours of US Primary Dealers in the US Treasury Market (September 14, 2026). Hong Kong Institute for Monetary and Financial Research (HKIMR) Research Paper No. 09/2026, Available at SSRN: https://ssrn.com/abstract=7458278 or http://dx.doi.org/10.2139/ssrn.7458278
This week for paid subscribers
Paid subscribers are getting a look at what happens when a massive anomaly database meets four decades of out-of-sample data. Across 210 published strategies, in-sample monthly returns average 0.671% but drop by roughly half outside that window. Pre-discovery and post-publication returns are statistically indistinguishable, proving the decay is driven by overfitting rather than academic arbitrage. Robustness checks confirm the shortfall is not a data backfilling artifact or a microcap distortion. Python backtest code included. [Part 1 of 2]

Disclaimer: The content provided in this newsletter, “Alpha in Academia,” is for informational and educational purposes only. It should not be construed as financial advice, investment recommendations, or an offer or solicitation to buy or sell any securities or financial instruments. Past performance is not indicative of future results. The financial markets involve risks, and readers should conduct their own research and consult with qualified financial advisors before making any investment decisions.
The interpretations, opinions, and analyses presented herein are those of the author and do not necessarily reflect the views of the original researchers, their institutions, or the full implications of the cited academic papers. While every effort is made to accurately represent the research discussed, readers should be aware that the summaries and interpretations may not capture the full scope or nuances of the original studies. The information contained in this newsletter is believed to be accurate and reliable at the time of publication, but accuracy and completeness cannot be guaranteed. The author and publisher accept no liability for any loss or damage resulting from reliance on the information provided.
This newsletter may contain links to external websites or resources. The author is not responsible for the content, accuracy, or reliability of these external sources.
By subscribing to or reading this newsletter, you acknowledge that you have read and understood this disclaimer and agree to hold the author and publisher harmless from any liability that may arise from your use of the information contained herein.