

Welcome back to another issue of Recent Academic Research!
Let’s get into it.
Finding a Private Company's Public Twin
Private credit has exploded into a multi-trillion dollar asset class, but there is a basic problem, many private borrowers do not publish the kind of financial statements analysts need to estimate default risk, or the numbers arrive stale, months out of date. Researchers at BlackRock built a workaround using machine learning. They trained a random forest model (an algorithm that grows hundreds of decision trees) on thousands of publicly traded corporate bonds, using visible market signals like yield, spread, and bond structure to predict credit ratings. Then, instead of only using the model to make predictions, they mined its internal structure to measure “similarity” and find each private issuer’s closest public lookalikes, a small handful of public bonds trading like true peers. The private company’s implied rating becomes a weighted average of its public twins’ actual agency ratings.
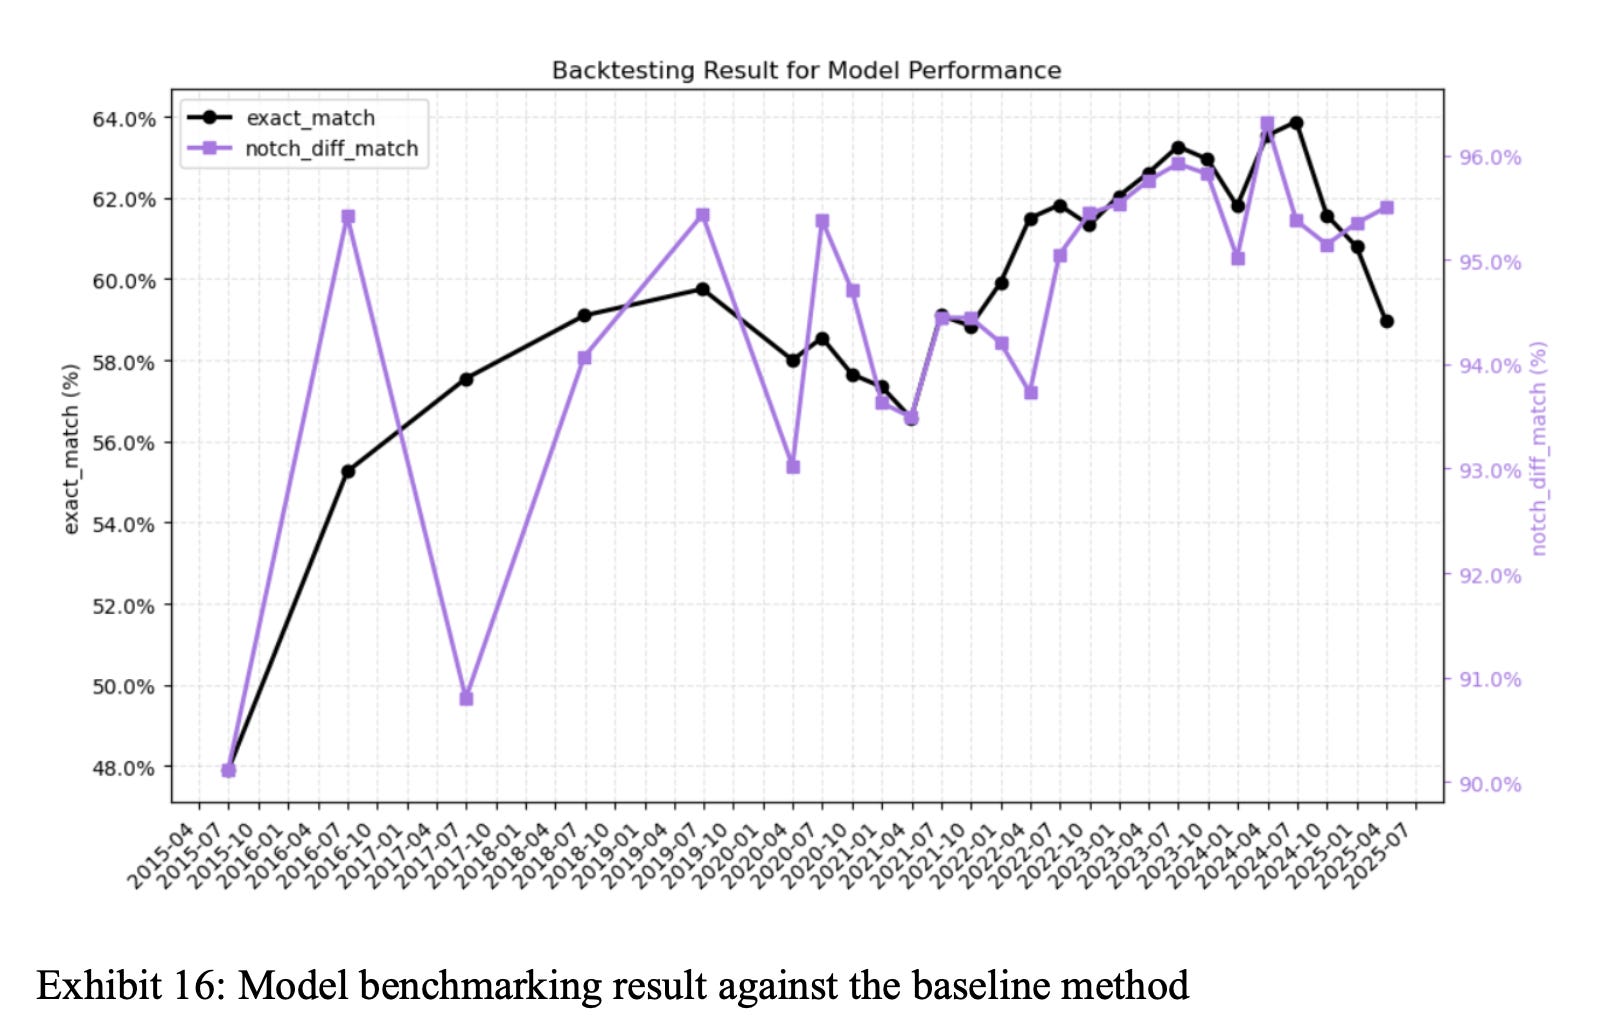
Tested across a ten-year period that includes the 2020 crash, the model landed on the exact rating band or within one notch of it, achieving “more than 95% accuracy for both NA and EMEA regions,” and consistently beat a simpler sector-average benchmark. For investors underwriting private credit deals with limited disclosure, this offers a transparent, data-driven second opinion on where a borrower’s true credit quality sits.
Yadav, Ravi and Saha, Anubhab and Singh, Saurabh and Turmuhambetov, Gauhar Akylbekovna and Mehta, Dhagash, A Machine Learning-based Public Market Equivalent Framework for Estimating Default Risk in Private Credit (April 15, 2026). Available at SSRN: https://ssrn.com/abstract=6916138 or http://dx.doi.org/10.2139/ssrn.6916138
Why Long-Term Rates Overreact
Uncertainty about how persistent a shock will be is, by itself, enough to make even a perfectly rational forecaster overreact to distant news and under react to recent news, at the same time.
Ask any forecaster how long a shock to inflation or interest rates will actually last, and they will admit they are not fully sure. This paper shows that this honest uncertainty, once you write it into the math, forces long-horizon forecasts to become steadily more persistent and to eventually overreact the further out you look, no matter what the true underlying process is or how carefully the forecaster reasons.
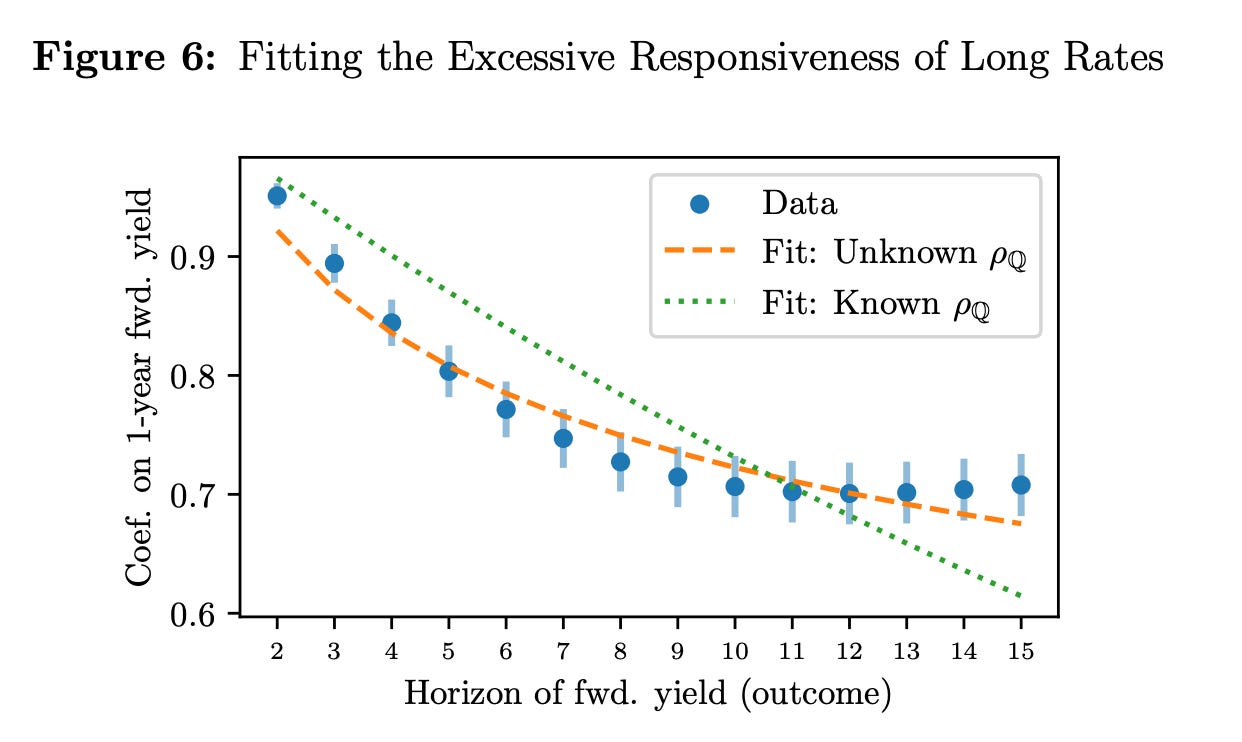
The authors trace this one mechanism through six long-standing puzzles in finance: why 15-year Treasury forward rates move almost in lockstep with short-term rates, why the long end of the yield curve gets explained away by a vague “term premium” instead of actual rate expectations, why bond returns look predictable after the fact, and why long-horizon asset prices are excessively volatile. Fitting the model to the real Treasury curve, modest uncertainty (nothing exotic, just not being sure whether short rate persistence is 0.85 or 0.95) reproduces these patterns closely. As the authors put it, forecasts are “necessarily as persistent as is believable and over-react.” For investors, this means the long end of the curve may be less about bias or mispricing than about honest uncertainty doing exactly what the math says it must.
Greg Kaplan and Ken Miyahara, “How Does Monetary and Fiscal Policy Affect the Economy in the Face of Large Shocks?,” NBER Working Paper 35400 (2026), https://doi.org/10.3386/w35400.
What the VIX Doesn’t Tell You
The VIX, the “fear gauge” quoted everywhere from CNBC to options desks, is built from a formula that implicitly assumes you can observe option prices at every possible strike, from zero to infinity. In practice, exchanges only trade a limited band of strikes, and nobody prices the extreme tails. This paper shows that gap is not a minor technicality. For the standard VIX formula, and for nearly every popular measure of skewness and kurtosis used in academic finance, the missing tail information means there is no upper limit on what the true value could be. The number everyone reports is just one arbitrary point plucked from an unbounded range of values, all equally consistent with the option prices actually observed.
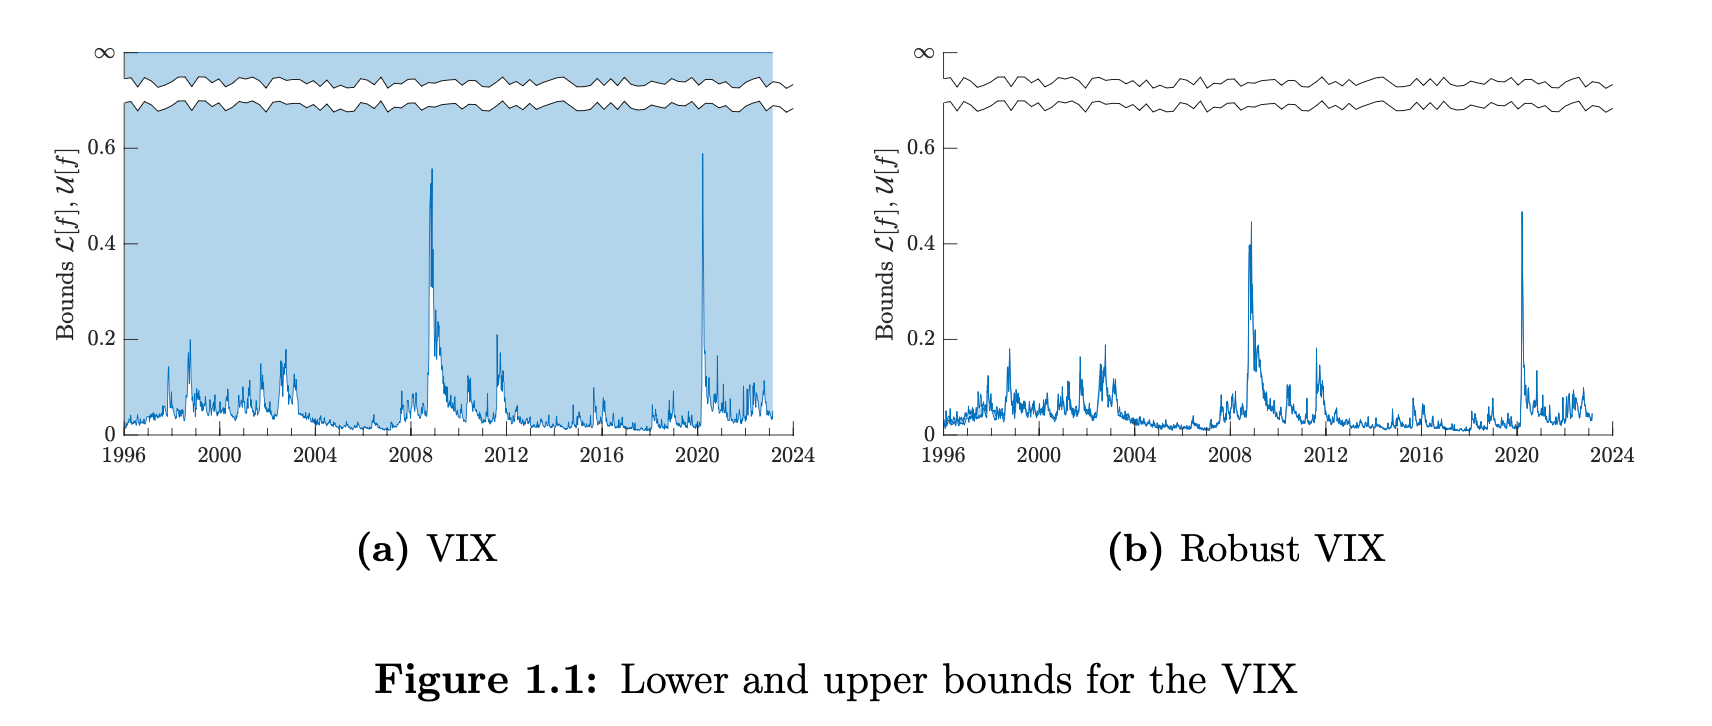
Predictive regressions and cyclicality studies built on these measures can be engineered to show almost anything, “rendering their empirical conclusions largely uninformative.” The authors also propose a fix, a family of alternative variance and skew measures that stay tightly bounded using the same visible data. For investors leaning on the VIX or similar option-implied signals, the point is blunt: the number is standing in for a far wider range of possibilities than it lets on.
Bondarenko, Oleg and Dillschneider, Yannick and Schneider, Paul Georg and Trojani, Fabio, What can you Really Tell from Option Prices? (June 24, 2026). Swiss Finance Institute Research Paper No. 26-49, Available at SSRN: https://ssrn.com/abstract=7017219
The Billion-Dollar Minimum for Bond Indexing
A bond portfolio can be too small to track its own benchmark, no matter how skilled the optimizer, because minimum trade sizes set a hard floor on how close it can get.
Bond portfolio optimization has always felt like equity optimization’s neglected cousin, and a new paper from an Amundi research team explains why, then builds the missing framework from scratch. The real payoff isn’t the math, it’s what happens when you try to actually trade the thing.
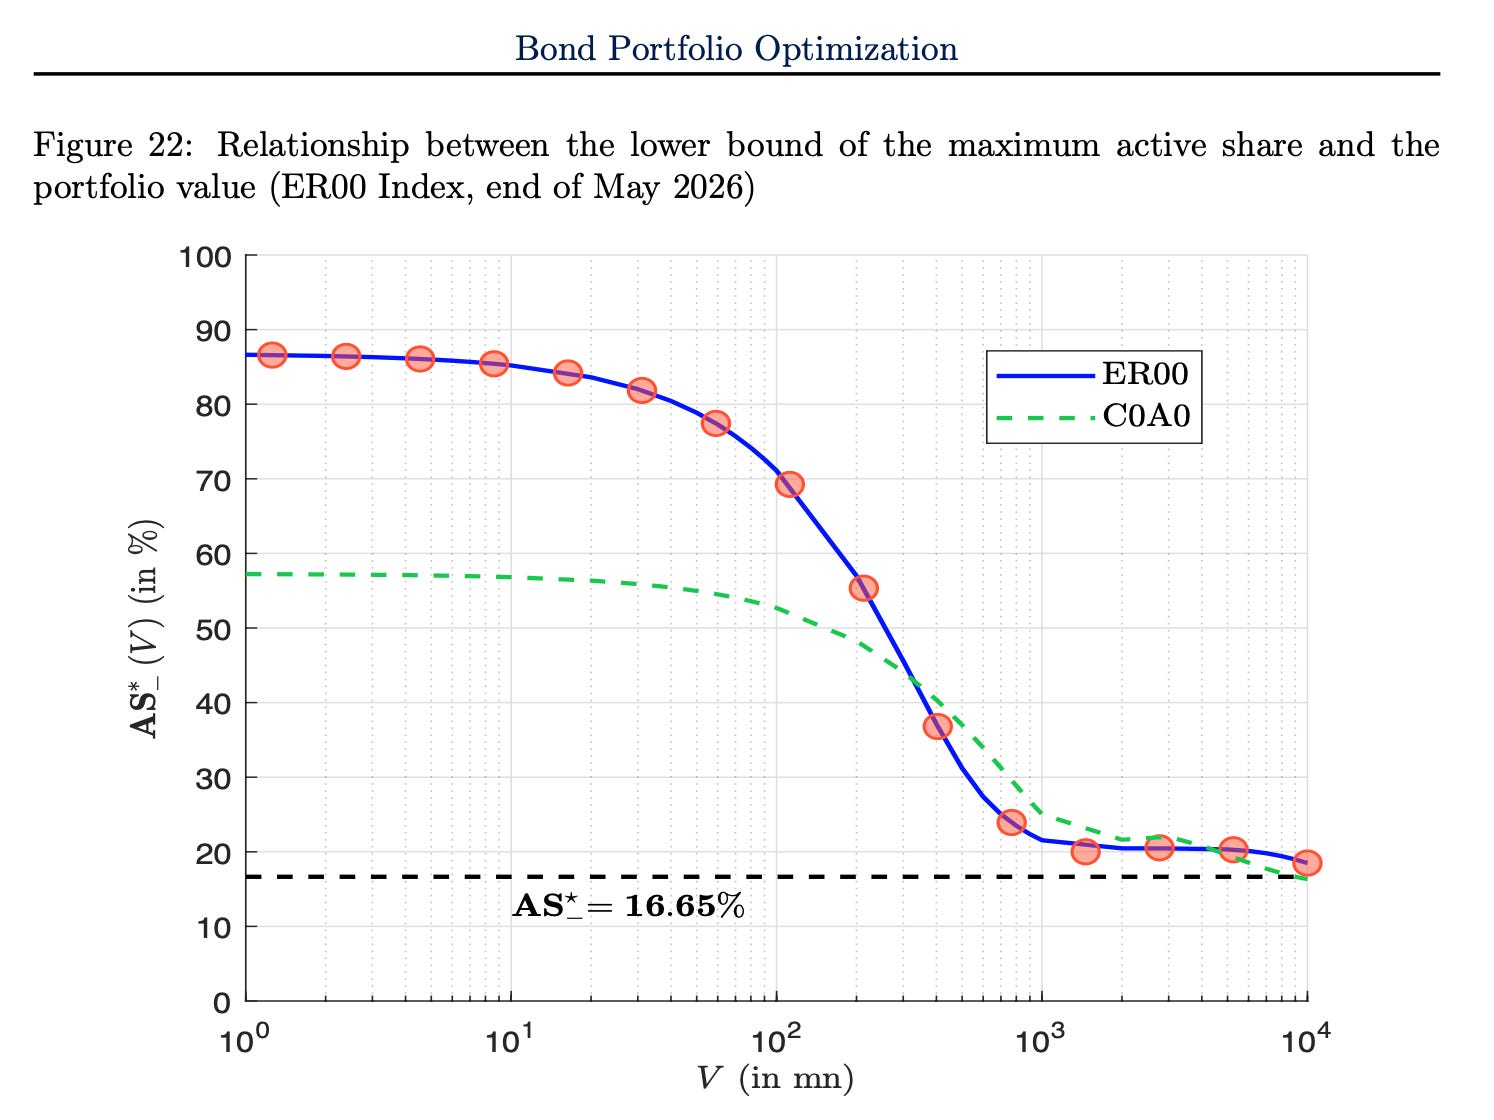
Using real ICE BofA corporate bond indices with anywhere from 4,663 to over 20,000 securities, the authors show that minimum trade sizes and lot constraints impose a hard floor on how closely a portfolio can hug its benchmark. At 50 million dollars, the best achievable active share (a measure of how much a portfolio diverges from its index) sits around 80% for the euro index and 85% for the global one, and these numbers only fall into reasonable territory once a portfolio crosses roughly a billion dollars. The paper notes this problem is “particularly acute for smaller portfolio sizes.” For anyone comparing bond ETFs or sizing up a smaller fixed income mandate, this is a reminder that tracking error isn’t just a skill problem, it’s a scale problem, and size alone can decide whether a strategy is even implementable.
Ben Slimane, Mohamed and Cherief, Amina and Roncalli, Thierry and Xu, Jiali, Bond Portfolio Optimization (July 03, 2026). Available at SSRN: https://ssrn.com/abstract=7064358
This week for paid subscribers
Paid subscribers are getting a look at whether crowded hedge fund positioning can actually be traded against. The post digs into why fading the crowd produces a clean, out-of-sample-stable edge in silver, why that same edge in gold is quietly decaying as the trade becomes more widely known, and why copper inverts the relationship entirely, exposing the fact that positioning was never the real signal, mean reversion was. Python backtest code included.

Disclaimer: The content provided in this newsletter, “Alpha in Academia,” is for informational and educational purposes only. It should not be construed as financial advice, investment recommendations, or an offer or solicitation to buy or sell any securities or financial instruments. Past performance is not indicative of future results. The financial markets involve risks, and readers should conduct their own research and consult with qualified financial advisors before making any investment decisions.
The interpretations, opinions, and analyses presented herein are those of the author and do not necessarily reflect the views of the original researchers, their institutions, or the full implications of the cited academic papers. While every effort is made to accurately represent the research discussed, readers should be aware that the summaries and interpretations may not capture the full scope or nuances of the original studies. The information contained in this newsletter is believed to be accurate and reliable at the time of publication, but accuracy and completeness cannot be guaranteed. The author and publisher accept no liability for any loss or damage resulting from reliance on the information provided.
This newsletter may contain links to external websites or resources. The author is not responsible for the content, accuracy, or reliability of these external sources.
By subscribing to or reading this newsletter, you acknowledge that you have read and understood this disclaimer and agree to hold the author and publisher harmless from any liability that may arise from your use of the information contained herein.