

The Stickiness of Sentiment: Why Some Bad News Is Harder to Dislodge
Media sentiment is highly asymmetric across topics, meaning bad news decays far more slowly than good news, and this “stickiness” is surprisingly most severe in data-rich areas like corporate strategy and financial stability.
We all know the financial media loves a crisis, but it turns out the “stickiness” of bad news depends entirely on what the journalists are writing about. By digging into decades of Wall Street Journal archives, researchers discovered that unexpected negative news acts like a stubborn stain, lingering in media narratives much longer than positive developments of the exact same magnitude. While you might assume that data-heavy topics would correct themselves quickly as fresh information arrives, the opposite happens. In fields like corporate strategy, real estate, and financial stability, bad news frequently opens up a cascading narrative of uncertainty, triggering follow-up coverage, earnings revisions, and secondary anxieties that feed on themselves for up to a year.
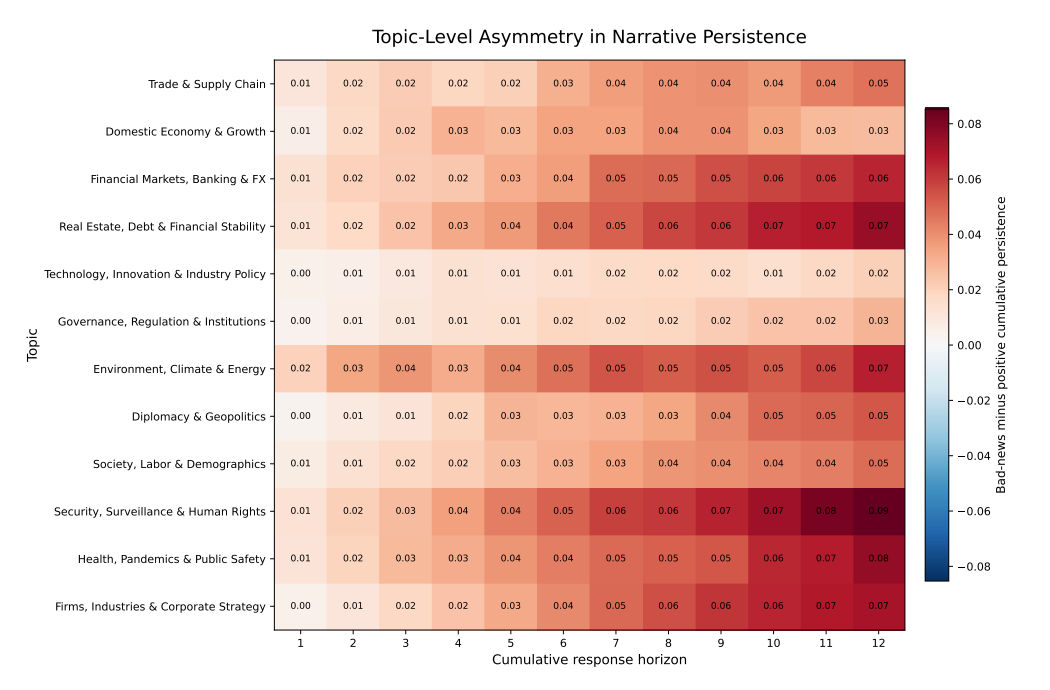

Figure 1: Within-topic asymmetry in cumulative sentiment persistence
For investors, this topic-level narrative inertia is a critical blind spot because aggregate sentiment indices completely mask these dynamics. A sudden drop in market mood might not mean macroeconomic fundamentals are decaying, but rather that media attention has rotated into a specific topic where negative narratives are naturally harder to dislodge. Ultimately, understanding this asymmetry matters because where bad news lands matters as much as how bad it is.
Agarwal, Isha and Chen, Wentong and Prasad, Eswar S., When Does Bad News Stick? Topic-Level Asymmetry in Narrative Dynamics (May 21, 2026). Available at SSRN: https://ssrn.com/abstract=6812261 or http://dx.doi.org/10.2139/ssrn.6812261
How Execution Discipline Rescues Crypto Machine Learning
The core finding of this paper is that hourly machine-learning models can generate highly profitable trading signals for Bitcoin, but these gains completely disappear under realistic transaction costs unless the trading strategy explicitly filters out weak, low-conviction forecasts to suppress excessive turnover.
Financial machine learning often suffers from a frustrating gap between statistical accuracy and actual trading profitability, a reality that becomes glaringly obvious at short horizons. When testing standard machine learning models on hourly Bitcoin data, the raw predictive signals look promising on paper. However, if you naively execute every single signal flip, the strategy quickly self-destructs. Because hourly forecasts constantly hover around zero, a simple sign-based rule triggers non-stop trading, allowing standard transaction costs to quietly bleed the account dry. To save the strategy from death by a thousand cuts, the authors introduce a cost-aware filter that blocks any trade where the forecast magnitude fails to outweigh the cost of execution.
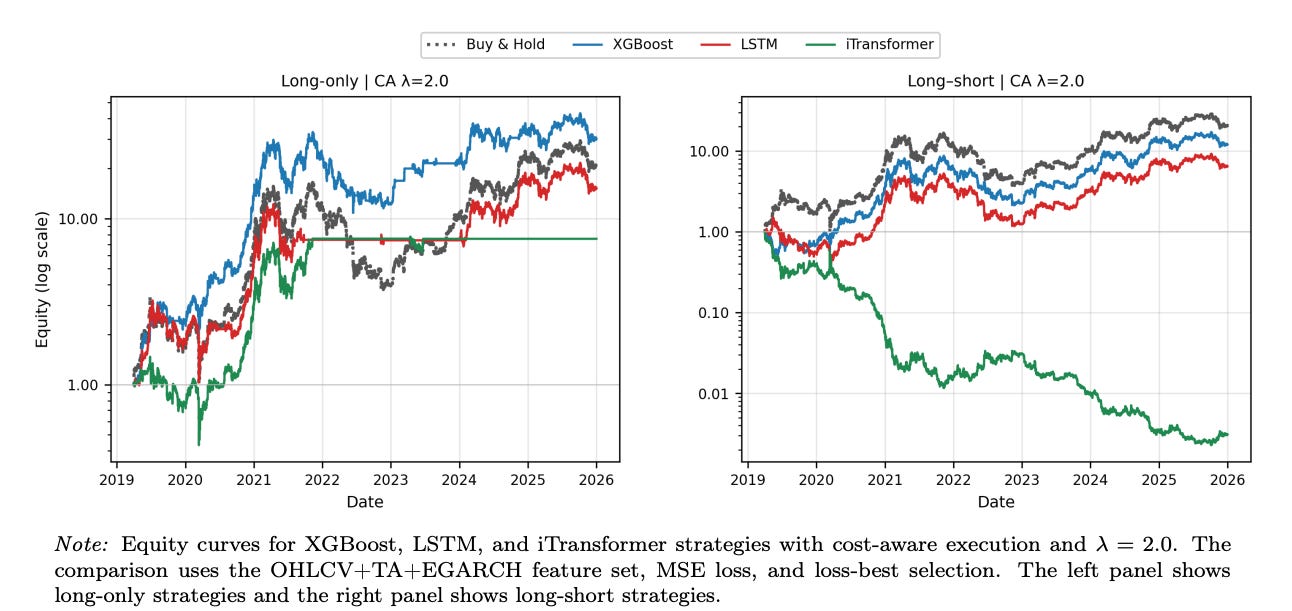
Figure 3: Impact of model architecture on cost-aware strategy performance
This simple addition changes everything, drastically cutting down unnecessary trades and unlocking an annualized return above 65% for the top-performing model configuration. Interestingly, the tree-based XGBoost architecture proved descriptively tougher to beat than its complex neural network alternatives. Ultimately, this research matters because it shifts the spotlight away from complex model tuning and back to raw execution discipline, proving that market alpha depends less on finding a perfect model and more on whether your trading system has the patience to sit on its hands. As the authors aptly note in their conclusion, “short-horizon predictive signals are fragile, transaction costs are powerful, and the path from forecast to trade matters as much as the forecasting model itself”.
Bysik, Andrei and Ślepaczuk, Robert, Machine Learning-Based Bitcoin Trading Under Transaction Costs: Evidence From Walk-Forward Forecasting (May 19, 2026). Available at SSRN: https://ssrn.com/abstract=6795938 or http://dx.doi.org/10.2139/ssrn.6795938
Why Rules Beat Raw Math Out of Sample
Constrained portfolio optimization and Bayesian models like Black-Litterman significantly outperform standard mean-variance strategies in real-world market conditions by curbing extreme asset concentration and reducing sensitivity to input errors.
When you let a standard computer algorithm build an optimal stock portfolio based purely on historical data, it tends to behave like a reckless gambler, aggressively piling nearly eighty percent of your money into just three large companies. This structural quirk, known as the corner portfolio problem, happens because the math chases low volatility on paper while ignoring real-world concentration risk. To see how we can fix this, we examined a research paper that tracked ten major United States stocks through recent market cycles. By forcing the model to obey simple diversification rules, such as capping any single stock position at fifteen percent, the portfolio surprisingly beat the unconstrained strategy in out-of-sample testing, delivering a smoother ride and higher risk-adjusted returns.
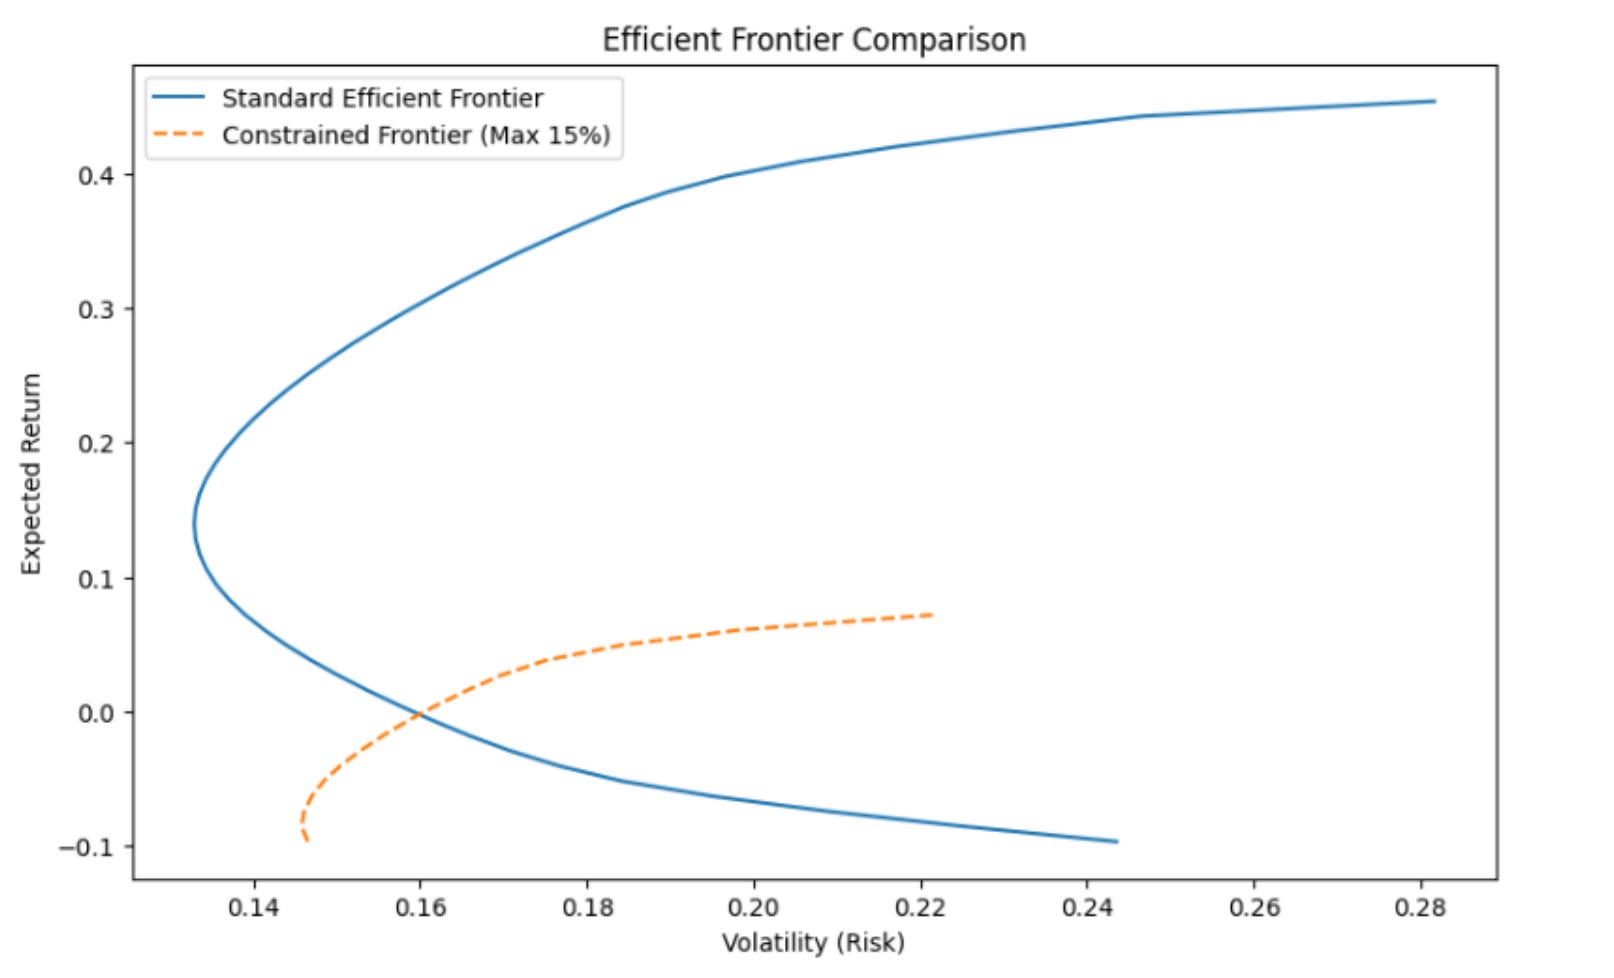
Figure 3: Constrained vs Unconstrained Efficient Frontier
The researchers also integrated the Black-Litterman model, a clever framework that anchors your portfolio to the broader market and only deviates when you have high-confidence, specific trading views. For investors, this paper proves that raw mathematical efficiency in a backtest is often a mirage, and that trading constraints are not annoying roadblocks, but rather essential tools that enhance actual portfolio robustness when market regimes inevitably shift. As the authors note in their closing remarks, institutional asset management requires frameworks that provide a “more stable and economically realistic foundation for long-term portfolio allocation decisions.”
Verma, A. K., & Barkam, S. (2026). From Classical Optimization to Bayesian Integration: A Comprehensive Analysis of Systematic Portfolio Management (arXiv:2605.29413v1). arXiv. https://doi.org/10.48550/arXiv.2605.29413
The Trump Factor Moves the Markets
Elections trigger positive short-term stock index returns alongside sharp spikes in market volatility, while political communication via social media moves trading volume and specific sectors in a transient fashion.
No other politician has stood in the crosshairs of financial analyses as frequently as Donald Trump, and the accumulated data reveals that his words and victories consistently move markets. When looking at aggregate index reactions, his election victories historically trigger an immediate wave of market optimism that drives stock prices up, though this is preceded by an uncertainty shock that sends option-implied volatility soaring before it plummets post-election. Beneath the surface, a fascinating sector-specific risk rotation occurs. Capital routinely flows out of defensive, safe-haven assets like utilities and health care, rushing instead into growth-sensitive cyclical industries, financials, and heavily regulated “brown” assets anticipating domestic deregulation.
Interestingly, the data shows that while fossil fuel equities enjoy an immediate post-election bump, these gains are remarkably short-lived and segment back to zero within weeks, suggesting that long-term market forces tend to outlast symbolic policy shifts. For the modern investor, this comprehensive synthesis highlights that political rhetoric and electoral surprises create robust, highly tradable pockets of short-term volatility, but underlying economic realities ultimately dictate long-term asset pricing.
Batt, Elias-Noah and Munkow, Jan and Schiereck, Dirk, The Finance Researcher’s Favorite – President Donald Trump and the Stock Market. Available at SSRN: https://ssrn.com/abstract=6813771 or http://dx.doi.org/10.2139/ssrn.6813771
This week for paid subscribers
Paid subscribers are getting a look at how out-of-sample physical grid signals can expose predictable volatility corridors, and how an expanding multi-factor regression can harvest those imbalances before real-time delivery. Python backtest code included.

Disclaimer: The content provided in this newsletter, “Alpha in Academia,” is for informational and educational purposes only. It should not be construed as financial advice, investment recommendations, or an offer or solicitation to buy or sell any securities or financial instruments. Past performance is not indicative of future results. The financial markets involve risks, and readers should conduct their own research and consult with qualified financial advisors before making any investment decisions.
The interpretations, opinions, and analyses presented herein are those of the author and do not necessarily reflect the views of the original researchers, their institutions, or the full implications of the cited academic papers. While every effort is made to accurately represent the research discussed, readers should be aware that the summaries and interpretations may not capture the full scope or nuances of the original studies. The information contained in this newsletter is believed to be accurate and reliable at the time of publication, but accuracy and completeness cannot be guaranteed. The author and publisher accept no liability for any loss or damage resulting from reliance on the information provided.
This newsletter may contain links to external websites or resources. The author is not responsible for the content, accuracy, or reliability of these external sources.
By subscribing to or reading this newsletter, you acknowledge that you have read and understood this disclaimer and agree to hold the author and publisher harmless from any liability that may arise from your use of the information contained herein.