

Welcome back to another issue of Recent Academic Research!
Let’s get into it.
Lever Up Your IRA, Says the Retirement Model
A leveraged ETF held for years doesn’t decay the way its warning label says, and a standard retirement model actually wants one in your IRA.
A 2x leveraged ETF promises double the S&P 500’s move every day, and since 2009 regulators have warned that the daily reset makes it rot over long holds, the famous “volatility drag.” Lai and Reilly model nearly every US equity leveraged ETF and find that volatility alone doesn’t lower the average return at all. Two things do cost you. The first is rebalancing: To stay at 2x, the fund adds exposure after up days and trims it after down days, and because indexes tend to partly reverse the next day, it ends up buying high and selling low. The second is rent on the leverage, which funds get from banks through swaps at about 1.3 percentage points over the Fed’s overnight rate.
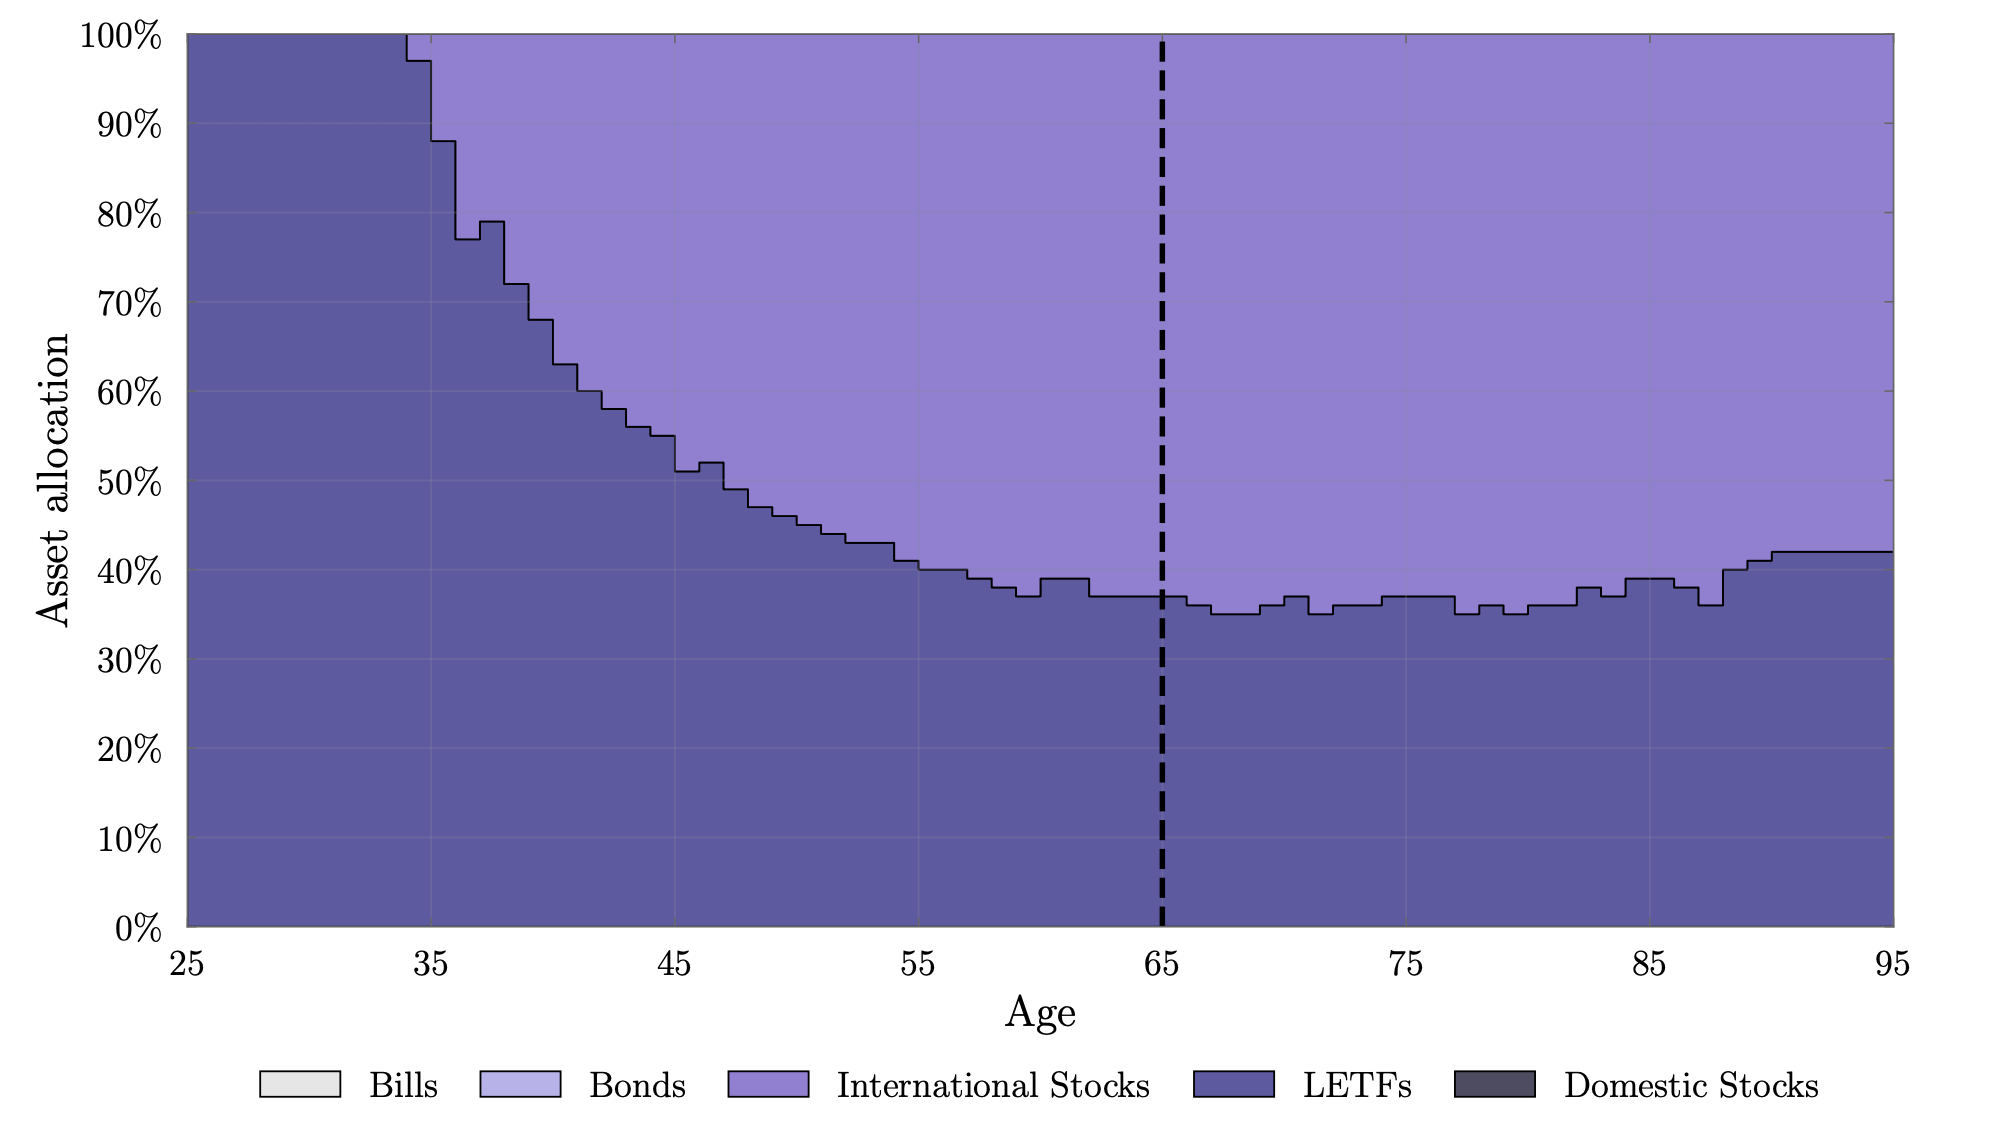
Figure 1: The optimal retirement portfolio in the authors’ model. The household holds only a 2x S&P 500 fund (dark) until its early thirties, then gradually adds international stocks (light), but never drops below roughly a third in the leveraged fund, even after retiring at 65 (dashed line). Bonds and bills never make the cut.
The myth survives because leverage makes results lopsided, a few huge years and many losing ones, so anyone eyeballing past charts mostly sees losers. Put a 2x S&P fund into a standard retirement model and the optimal household holds it for life, and holds nothing else while young. So the product built for day traders suits the most boring investor imaginable.
The math seems reasonable, but the fragile part is that the model assumes you never panic sell in a crash. If you already hold only stocks in an IRA, where margin is banned, a slice of a 2x index fund is defensible. Judge it by its swap costs and how closely it tracks its target, not by its volatility tables. If you still hold bonds, raise your stock share first.
Reilly, Christopher and Lai, Qihao, Lever Up Your IRA: Understanding the Long Run Performance of Leveraged ETFs (October 19, 2026). Available at SSRN: https://ssrn.com/abstract=7638818 or http://dx.doi.org/10.2139/ssrn.7638818
Funds That Inflate Themselves
When a fund that owns thinly traded stocks grows fast, its own buying pumps up its returns, investors chase those returns with more money, and the loop tends to end badly a few years later.
If you buy a lot of a stock that barely trades, its price goes up. Now picture a fund holding a basket of thinly traded names that gets new money every day. It invests that money in its existing proportions, so it keeps buying the same small stocks, which lifts their prices, which shows up as a nice return. Investors see the return and send more money, in effect applauding their own purchases.
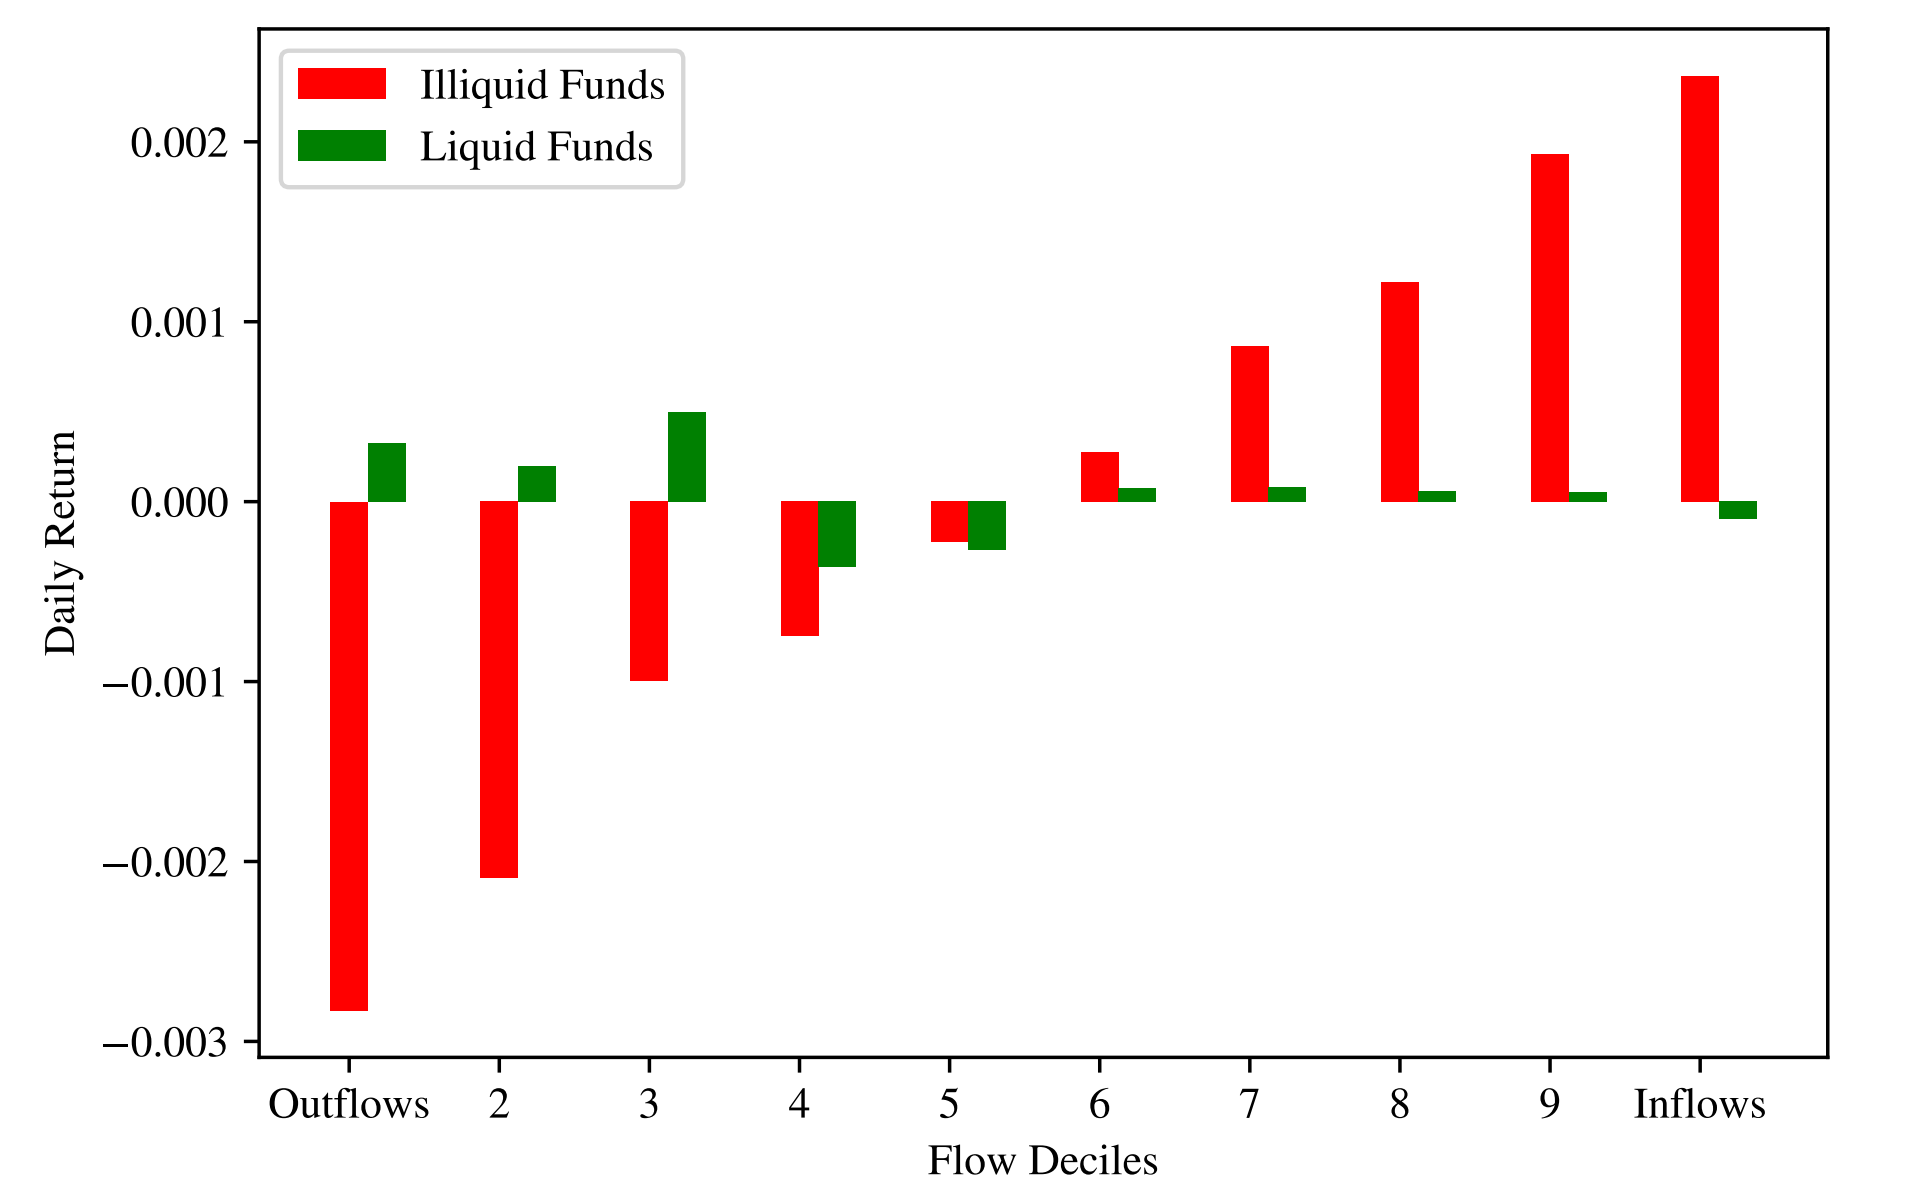
Figure 2: Each day, ETFs are sorted by how much new money they took in. For funds concentrated in thinly traded stocks, returns rise in lockstep with inflows. For funds holding easily traded stocks, new money barely moves returns. Returns are measured relative to the overall market.
The authors measure this with “fund illiquidity,” roughly how much of its holdings’ daily trading volume a fund has to buy when new money arrives, beyond what its most liquid possible portfolio would require.
What was surprising is that nobody leans against it. Managers barely shift toward easier stocks as they grow (bigger funds mean bigger fees). Investors chase this price pressure as eagerly as real stock picking. And shorting illiquid small caps hurts when the crash takes years to arrive. It does arrive. Stocks where these inflated funds owned over 5% of shares lost about 30% over the next three years, which the authors call “a dynamic akin to fire sales, but in the positive direction.”
The long run evidence rests on a fairly small number of mutual fund episodes, so treat the size of that drop as rough. A broad S&P 500 fund is untouched by this. If you hold a thematic ETF that ballooned after a hot year, check how big a slice of each holding it owns before reading its record as skill.
van der Beck, Philippe and Bouchaud, Jean-Philippe and Villamaina, Dario, Self-Inflated Funds (May 20, 2024). Harvard Business School Finance Working Paper No. 26-066, Harvard Business School Working Paper No. 26-066, Available at SSRN: https://ssrn.com/abstract=4834390 or http://dx.doi.org/10.2139/ssrn.4834390
Rating Downgrades and the Funds That Buy Them
When a bond gets downgraded, actively managed bond funds tend to buy it, and the ones they pick usually recover.
When a rating agency cuts a company’s credit grade, lots of bondholders sell, and most of them haven’t learned anything new. Insurers face capital rules tied to ratings, especially when a bond drops from investment grade to junk, and retail investors tend to treat the rating itself as the verdict. Active bond funds face neither constraint, so they take the other side. They buy more when the downgrade was predictable and when other signals point up.
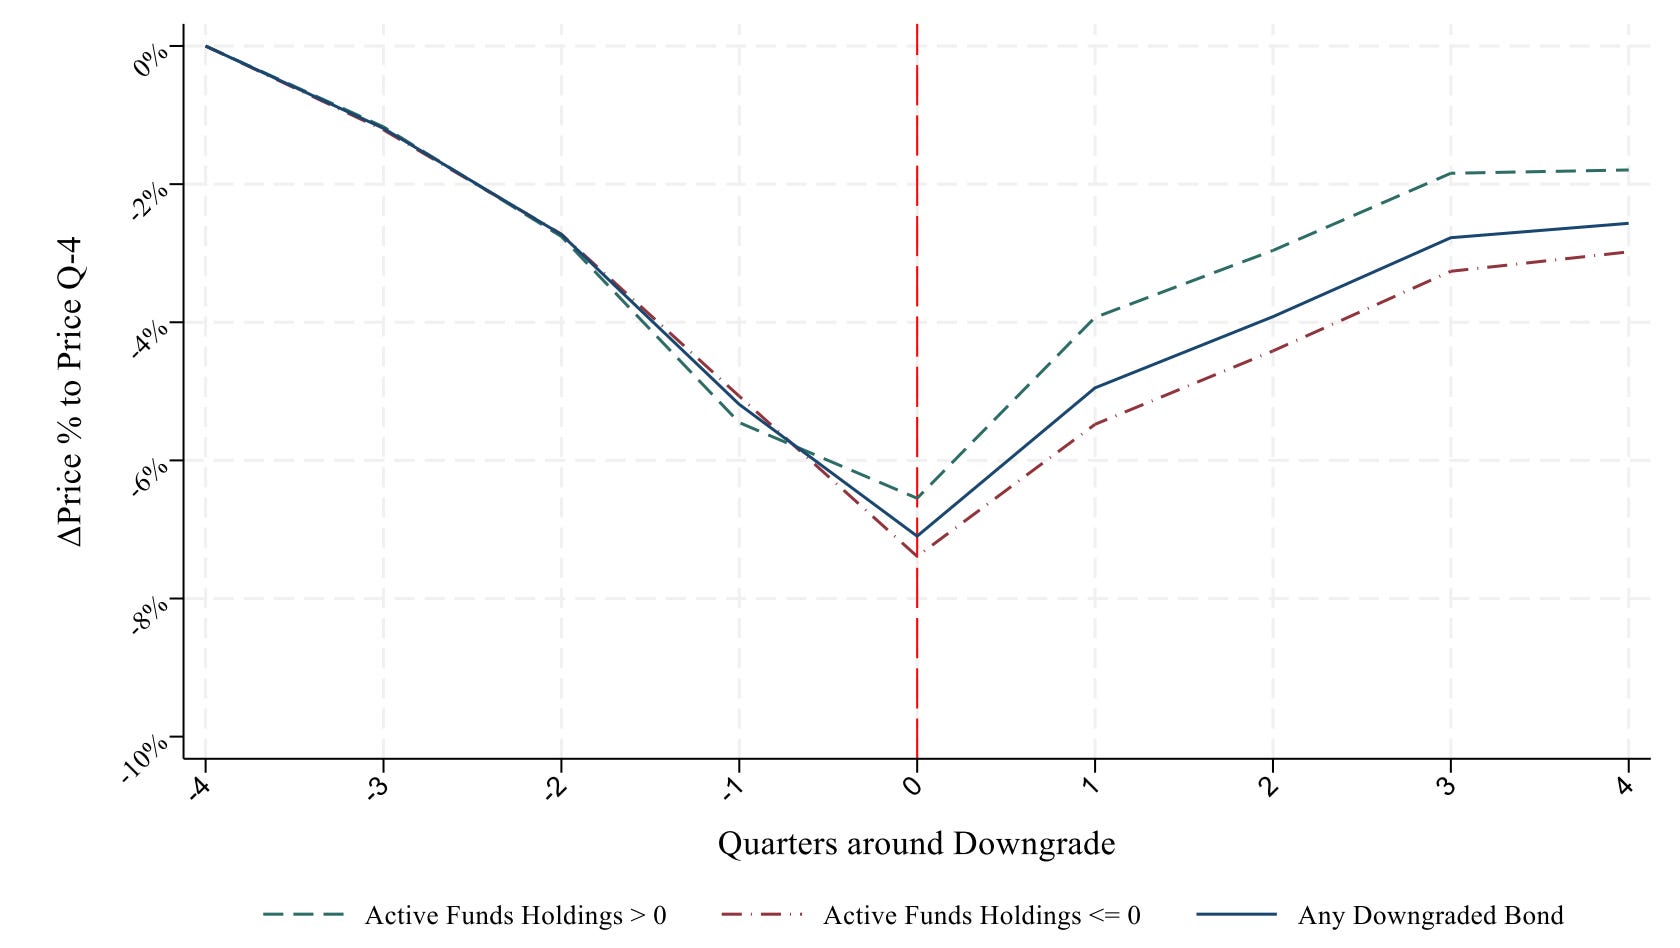
Figure 3: Downgraded bonds lose roughly 7% over the year before the cut. Afterward, the ones active funds bought recover faster than the ones they passed on. Prices are shown relative to four quarters before the downgrade.
The bonds they buy beat the downgraded bonds they skip by about 0.84 percentage points over the next year, roughly a typical active bond fund’s annual fee, and they default less often. The authors call these funds “informed liquidity providers that process forward-looking credit information.”
The gap survives because corporate bonds trade rarely, and dealers have had less room to hold them since the Volcker Rule, which also shrank the funds’ buying. The catch is that the data are quarterly snapshots, so nobody sees the prices funds actually paid or whether the edge survives trading costs. If you own a bond index ETF, you are on the selling side whenever a bond falls out of the index, which makes this one of the few places an active bond fund’s fee looks earned.
Andreani, Martina and Juliani, Elsa Maria and Vasvari, Florin P., Corporate Bond Ownership and Rating Downgrades (September 28, 2026). Available at SSRN: https://ssrn.com/abstract=7609643 or http://dx.doi.org/10.2139/ssrn.7609643
Digitalizing a State Monopoly, Repricing County Debt
When Pennsylvania legalized online lottery sales, bond investors started charging the counties most dependent on lottery-funded senior programs a little less to borrow, months before anyone bought a ticket online.
Pennsylvania’s lottery profits pay for programs for older residents, and some counties rely on those programs far more than others relative to their own budgets. When the state let its lottery sell online, did that create new gambling or just move it off convenience store counters? Relative to New York, which stayed offline, total lottery play rose about 14 percent, and store sales rose too.
The bond story is subtler. Counties borrow by issuing municipal bonds, and the spread is the extra yield investors demand over Treasuries for the risk of lending to that county. A bigger state lottery pot lowers the odds that senior programs get cut in a lean year and pushed onto county budgets, so investors in the most dependent counties trimmed spreads by about 5 basis points when the law was signed, then did nothing at launch.
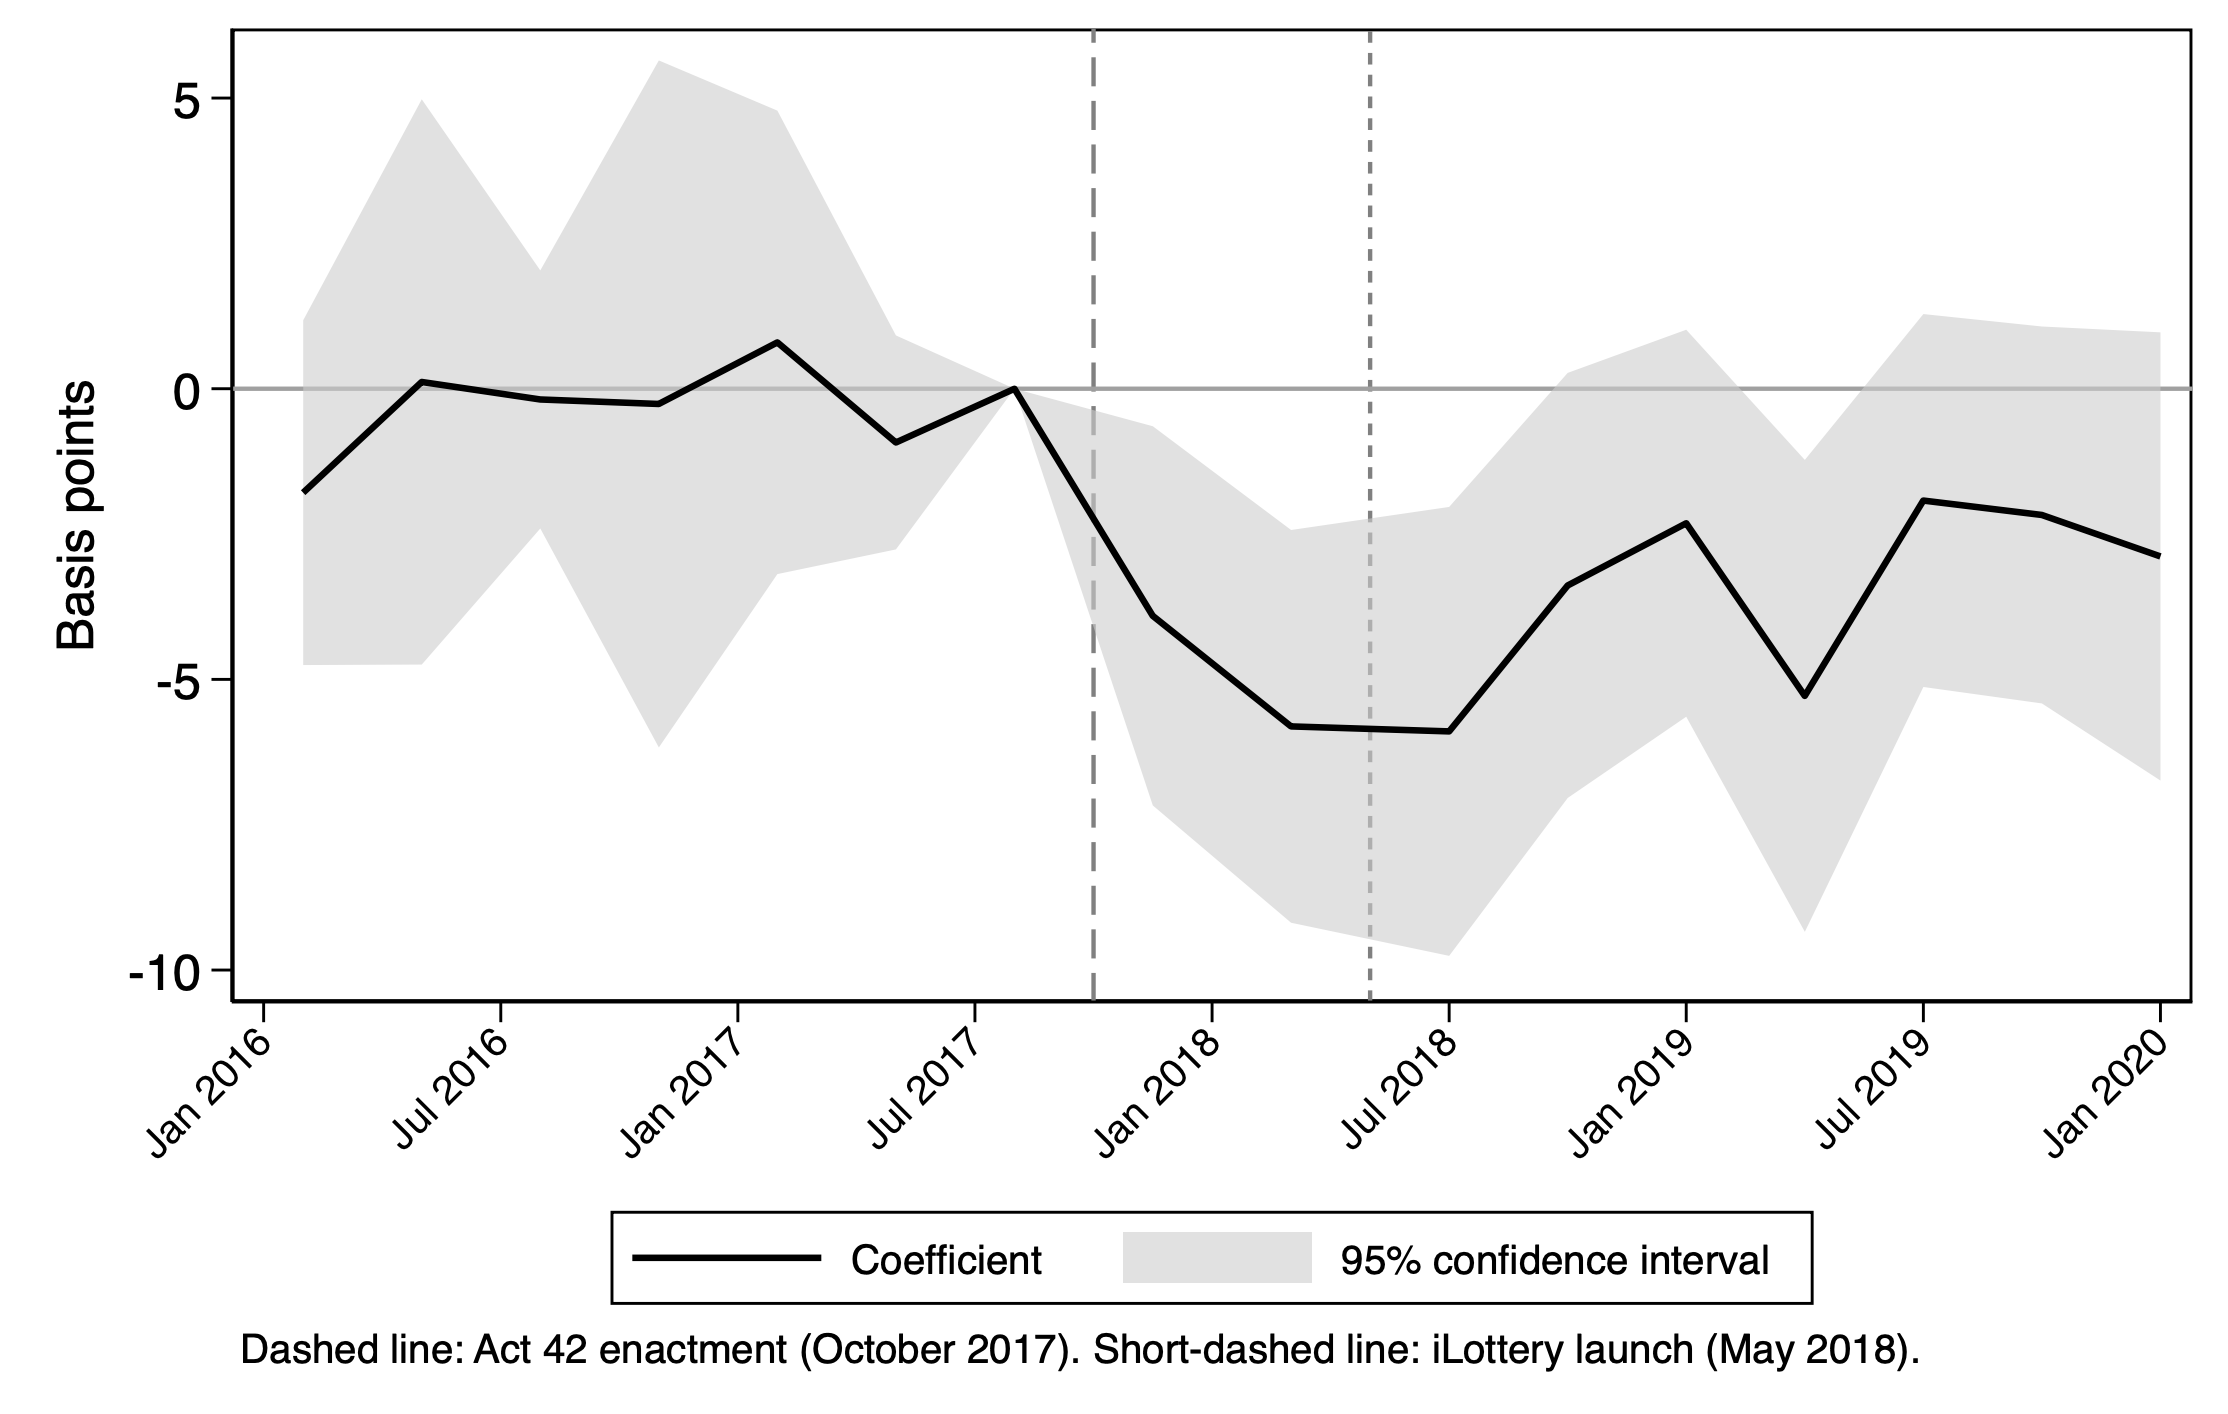
Figure 4: How much more cheaply Pennsylvania’s most lottery‑dependent counties could borrow, relative to less dependent counties, over time. Below zero means investors demanded less extra yield. The drop comes when the online lottery law was signed in October 2017, not when online sales began in May 2018.
Nobody arbitrages this away, because county bonds rarely trade and the move is small. The sample is a few dozen counties in one state, and the extra program money never visibly showed up, so I treat this as suggestive. If you hold a muni bond fund, there is nothing to trade here, but it is a clean example of prices moving when laws pass, not when money arrives.
Soylemezgil, Sevgi, Digitalizing a State Monopoly: Lottery Demand and Municipal Finance (May 10, 2026). Available at SSRN: https://ssrn.com/abstract=7657378 or http://dx.doi.org/10.2139/ssrn.7657378
Disclaimer: The content provided in this newsletter, "Alpha in Academia," is for informational and educational purposes only. It should not be construed as financial advice, investment recommendations, or an offer or solicitation to buy or sell any securities or financial instruments. Past performance is not indicative of future results. The financial markets involve risks, and readers should conduct their own research and consult with qualified financial advisors before making any investment decisions.
The interpretations, opinions, and analyses presented herein are those of the author and do not necessarily reflect the views of the original researchers, their institutions, or the full implications of the cited academic papers. While every effort is made to accurately represent the research discussed, readers should be aware that the summaries and interpretations may not capture the full scope or nuances of the original studies. The information contained in this newsletter is believed to be accurate and reliable at the time of publication, but accuracy and completeness cannot be guaranteed. The author and publisher accept no liability for any loss or damage resulting from reliance on the information provided.
This newsletter may contain links to external websites or resources. The author is not responsible for the content, accuracy, or reliability of these external sources.
By subscribing to or reading this newsletter, you acknowledge that you have read and understood this disclaimer and agree to hold the author and publisher harmless from any liability that may arise from your use of the information contained herein.
The point that the rebalancing cost, buying after up days and trimming after down days as indexes partly reverse, is what hurts a leveraged ETF rather than volatility itself is a useful reframe. The swap rent of about 1.3 points over the overnight rate then becomes the number worth watching.