

Welcome back to another issue of Recent Academic Research!
Let’s get into it.
The Real Value of a Limit Order
Posting a limit order at the best price beats paying up front, but once you count the trades you miss and have to chase, waiting still isn’t free.
Every trade starts with a choice: buy now at the asking price, or post a lower bid and wait for a seller. Waiting looks like free money, since you skip paying the spread. Peking University researchers priced that hope by replaying a year of Shenzhen order books, inserting a tiny hypothetical order, and charging it for every miss (unfilled after a minute, it buys at the ask). The catch is who fills you. Sellers tend to arrive before the price drops, and when it rises instead, the stock leaves without you. That cost never gets arbitraged away because whoever takes the other side earns the spread for carrying this risk.
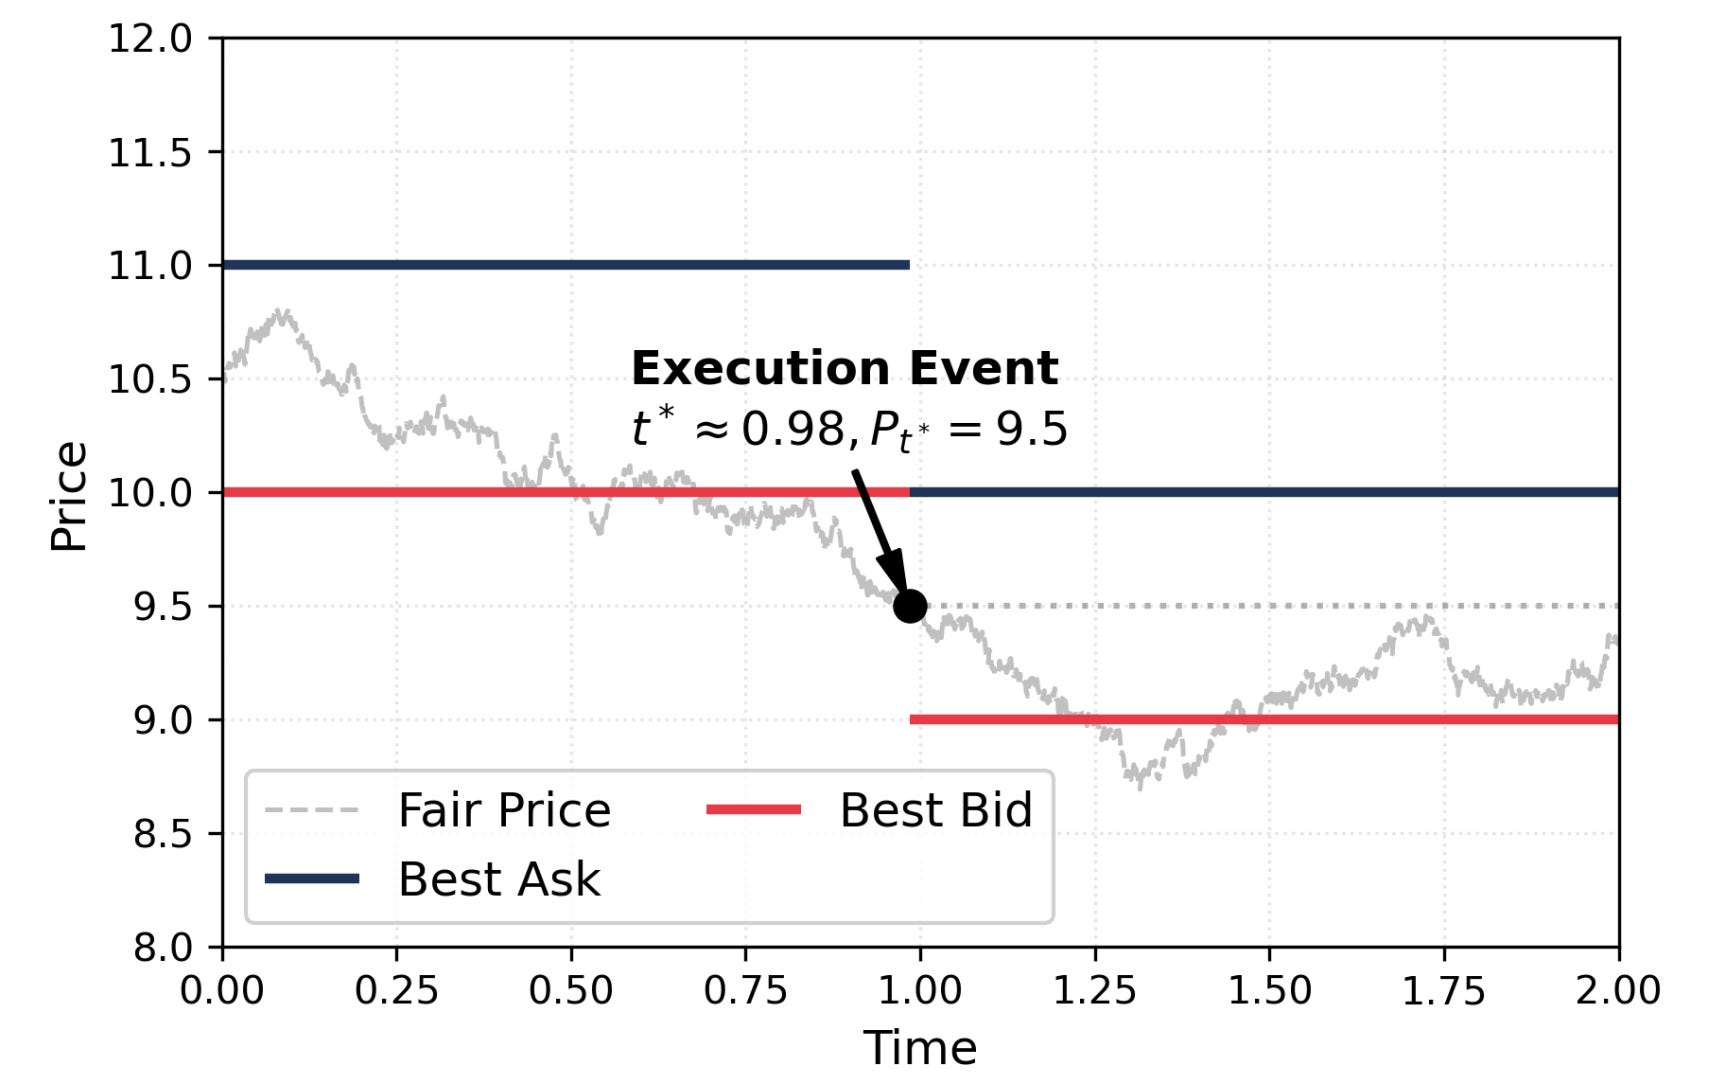
Figure 1: The mechanism of limit order execution. A simulated buy order waits at the bid and fills only when the price falls through it, so the trade happens just as the stock gets cheaper.
Against the midpoint, buying immediately cost about 7.7 basis points (hundredths of a percent) and bidding then chasing cost about 5.1, so patience won, by less than folklore suggests. What was surprising is that forecasting the whole payoff picks good moments to wait, while forecasting fills alone adds nothing (after careful tuning, the fill model decided its best move was the naive one). This is one year of Chinese stocks with simulated orders too small to move prices, so treat the magnitudes as local.
Dai, Yuehao and Chen, Yufan and Wu, Lan, The Value of Limit Orders in Execution (October 28, 2026). Available at SSRN: https://ssrn.com/abstract=7679747
Disclose More, Qualify Less
Whether an Indonesian company counts as investable depends a lot on which index provider is doing the counting, and Indonesia’s move to disclose more about who owns its companies has made them look less investable.
Index funds don’t buy every share a company has issued, only its “free float,” the shares that could actually trade rather than sitting with founders or governments. Fall below a minimum float and the stock gets cut. That sounds like a measurement, but Pal believes it’s a judgment call. He runs almost every Indonesian company’s shareholder register through the rules of MSCI, FTSE Russell, S&P and the Jakarta exchange. Same owners, four answers, and a large slice of the market passes under one rule and fails under another. Then, under pressure from MSCI, Indonesia began revealing smaller stakes in March 2026, and with ownership held fixed, seeing them roughly doubles the share of the market that looks closely held. The country that answered MSCI’s complaint by disclosing more now looks worse to MSCI, and the author warns that “the markets that disclose most may be penalised first.” Nobody arbitrages this away because it isn’t a mispricing, but a definition, and each fund follows the one it licenses.
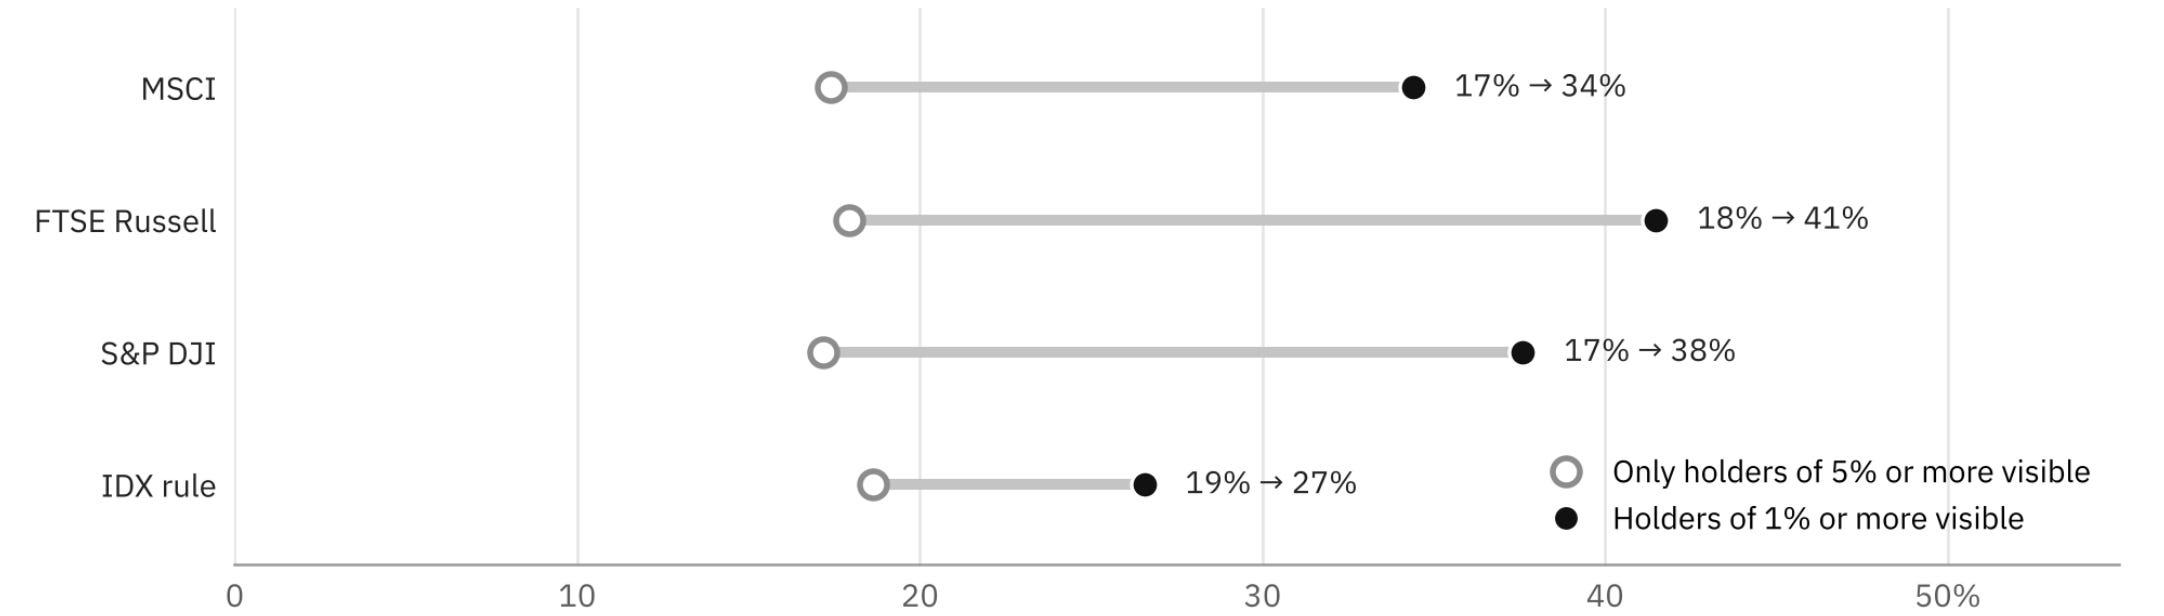
Figure 2: Same owners, more visibility. The share of Indonesia’s market value in companies with free float below 15%, under each rule-setter’s definition, before and after stakes between 1% and 5% became visible. Ownership is held fixed at August 2026, so the jump comes entirely from what can now be seen.
This seems more like a map, not a verdict, since these are the author’s reconstructions for one country at one date, by someone selling alternative index designs. For retail investors and ETF holders, iShares’ MSCI Emerging Markets fund holds nine Indonesian stocks and Vanguard’s FTSE version holds 69, so check which index your fund tracks before reading MSCI headlines as news about your own portfolio.
Pal, Mukul, Disclose More, Float Less: Free-Float Measurement and MSCI's 2026 Review of Indonesia (October 24, 2026). AlphaBlock Working Paper No. 2026-04. Also available on Zenodo: https://doi.org/10.5281/zenodo.23626765, Available at SSRN: https://ssrn.com/abstract=7666878 or http://dx.doi.org/10.2139/ssrn.7666878
Fewer Still Hold the Shares
Much of a stock’s trading volume is the same investors buying and selling back their own shares, so the standard model for working out who still owns a stock comes out roughly double the real number.
When a stock trades heavily, it’s natural to assume its owners are turning over. The standard tool for converting volume into ownership (the proportional trading model) bakes that in by assuming every share is equally likely to trade on any day. The authors wanted to test the accuracy of this model, and got the full Tel Aviv Stock Exchange record with a persistent ID for every investor. Over a year, only about 41% of shares bought ended up as net new holdings, against nearly 78% under the model. The rest was the same account buying and selling the same stock, often within a day, mostly broker proprietary desks, corporate accounts and active individuals, while pension funds barely churn.
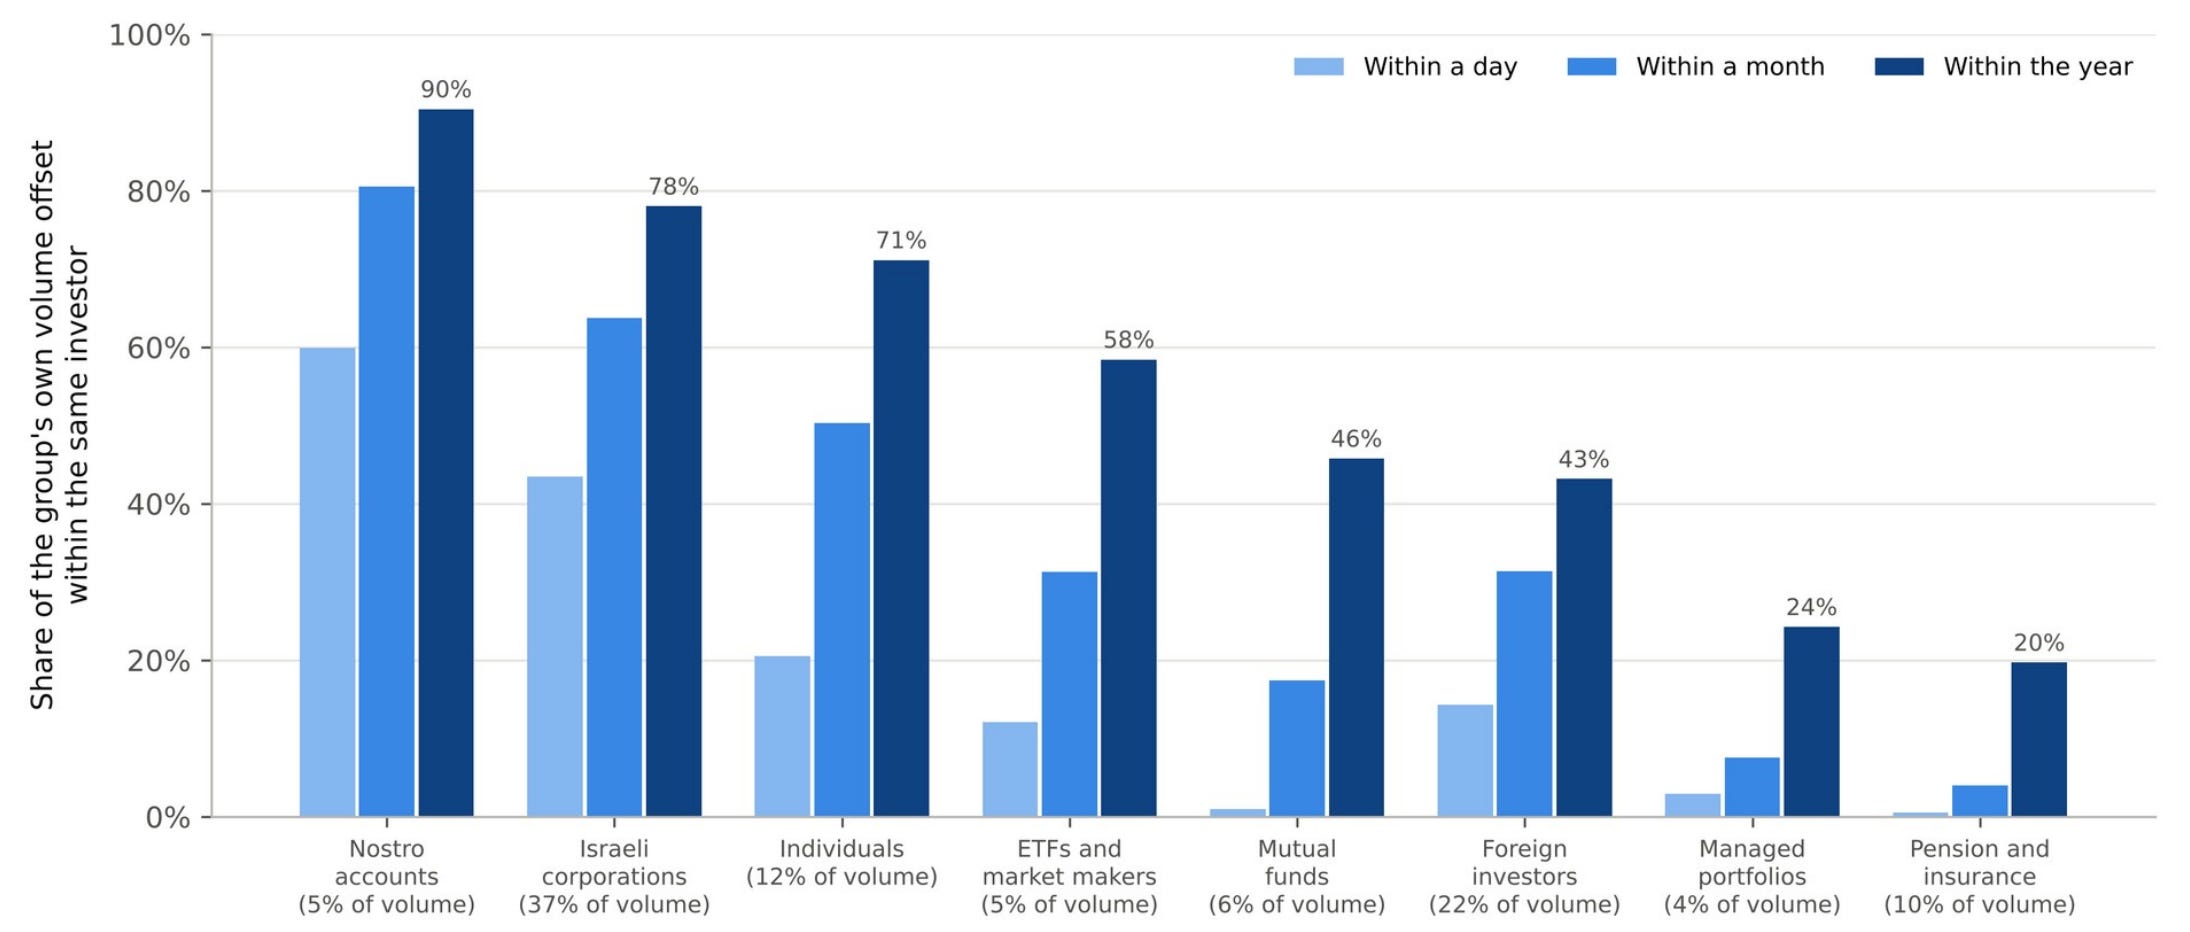
Figure 3: Share of each investor group’s own 2024 trading that the same account reversed in the same stock, within a day, a month and a year. Broker proprietary desks undo almost everything they buy, while pension and insurance funds mostly keep what they buy.
Nobody arbitraged this away because it isn’t a mispricing. It’s a measuring stick nobody could check, and it sets damages in U.S. securities class actions, where plaintiffs’ lawyers have little reason to complain about a model that doubles the class. What is convincing is how steady the gap is (about the same at a month as at a year), so a scaling fixes most of it. The caveat is that this is one market, and Israel’s investor mix may not travel. For index fund holders there’s nothing to trade here, but the next time a headline reads a volume spike as big holders fleeing, remember that “gross trading volume is a poor measure of ownership change.”
Mugerman, Yevgeny and Parchomovsky, Gideon and Wiener, Zvi, Who Still Holds the Shares? Investor-Level Evidence on Turnover-Based Models of Shareholder Positions (October 29, 2026). Available at SSRN: https://ssrn.com/abstract=7679905
Short Squeezes Come to the Corporate Bond Market
Corporate bonds get short squeezed more often than you’d guess, and the two kinds of squeeze push prices in opposite directions.
Shorting a bond works like shorting a stock. You borrow it, sell it, and hope to buy it back cheaper. The catch is the owner can ask for it back, and this paper, using nearly two decades of lending data, finds two ways that this goes wrong. In a lender squeeze, owners (often mutual funds facing redemptions) recall their bonds. One would expect prices to jump as short sellers scramble to buy, but on repeat recall days they fall, because the recalling lender usually wants to sell, and in a market this thin, the selling wins. A market squeeze is the familiar kind. A price jump forces short sellers (mostly dealers) to cover in installments, which keeps nudging junk bond prices up.
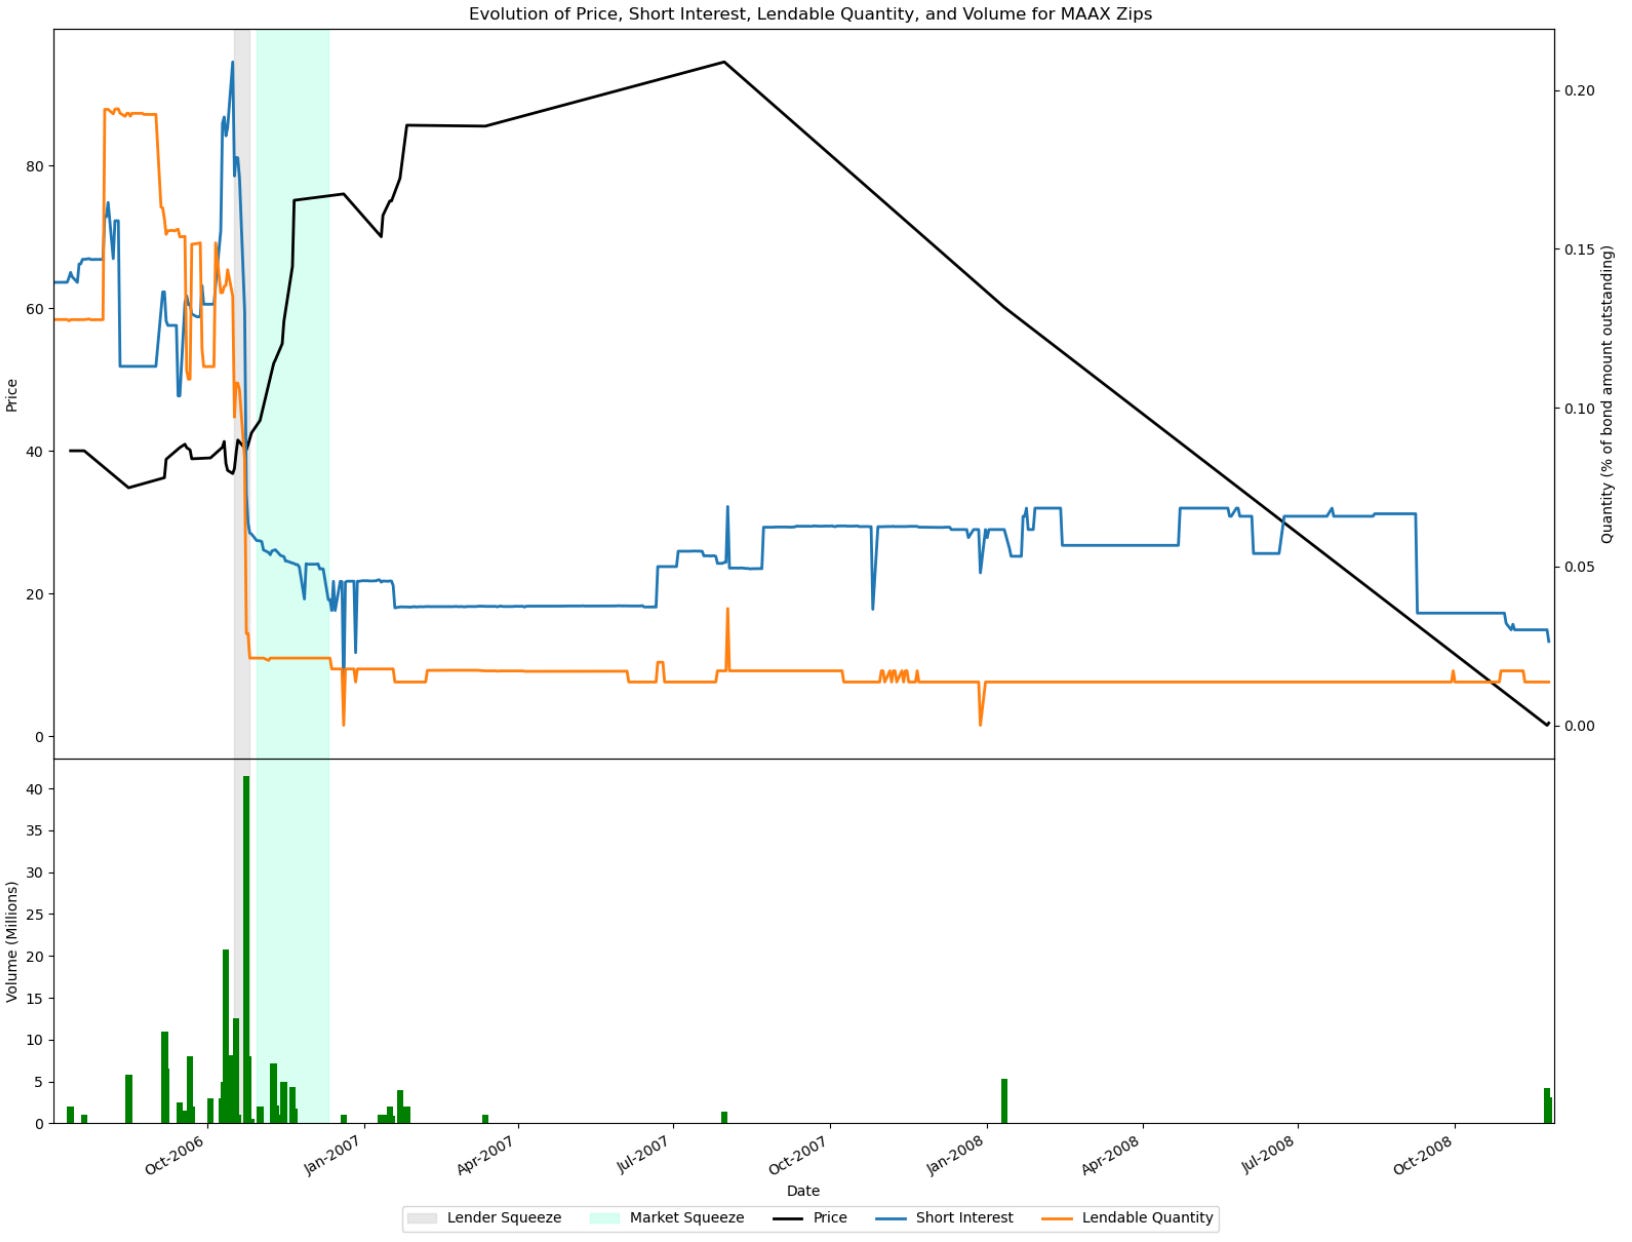
Figure 4: MAAX Holdings’ junk bonds, fall 2006. Lenders pulled their bonds back (gray), short sellers scrambled to cover (green), and the price roughly doubled within weeks. Here the lender recalling the bonds was also the buyer, which is why the price rose instead of fell.
It can get extreme (one hedge fund controlled 113% of a bond issue, which the SEC called manipulation). The pattern survives because the lending data sits behind a paid feed, and the paper’s 0.42% a month in junk bonds ignores trading costs where they are steepest, so treat it as a paper return. Both squeezes leave bonds less liquid, and squeezed junk bonds “respond more slowly to information reflected in their issuers’ equity prices.” If you hold a broad bond index fund, change nothing. If you own a narrow junk ETF or bonds rated CCC or lower, that’s where squeezes cluster and trading costs widen afterward.
Tengulov, Angel and Chakraborty, Biswajit and Cici, Gjergji and Ghaderi, Mohammad, Short Squeezes in the Corporate Bond Market (May 01, 2026). Available at SSRN: https://ssrn.com/abstract=7672878 or http://dx.doi.org/10.2139/ssrn.7672878
Disclaimer: The content provided in this newsletter, "Alpha in Academia," is for informational and educational purposes only. It should not be construed as financial advice, investment recommendations, or an offer or solicitation to buy or sell any securities or financial instruments. Past performance is not indicative of future results. The financial markets involve risks, and readers should conduct their own research and consult with qualified financial advisors before making any investment decisions.
The interpretations, opinions, and analyses presented herein are those of the author and do not necessarily reflect the views of the original researchers, their institutions, or the full implications of the cited academic papers. While every effort is made to accurately represent the research discussed, readers should be aware that the summaries and interpretations may not capture the full scope or nuances of the original studies. The information contained in this newsletter is believed to be accurate and reliable at the time of publication, but accuracy and completeness cannot be guaranteed. The author and publisher accept no liability for any loss or damage resulting from reliance on the information provided.
This newsletter may contain links to external websites or resources. The author is not responsible for the content, accuracy, or reliability of these external sources.
By subscribing to or reading this newsletter, you acknowledge that you have read and understood this disclaimer and agree to hold the author and publisher harmless from any liability that may arise from your use of the information contained herein.