

Welcome back to another issue of Recent Academic Research!
Let’s get into it.
Return-Optimal Regimes: Labeling Markets by What You Should Have Held
Defining a market “regime” as the holding path a reluctant trader would have wanted in hindsight, rather than a hidden statistical state, roughly doubles the risk-adjusted return of a simple industry rotation strategy.
Most regime models ask what state the market was probably in. Li and Mulvey ask a blunter question: Knowing what happened, which asset should you have held each day, assuming you hate trading?
They solve that exactly with a small dynamic program, then train one gradient-boosted classifier across all 46 Fama-French industries to predict those hindsight answers a day ahead. The setup is stacked in three layers. First, each industry is rotated against semiconductors as the aggressive bet. Second, when enough industries vote to retreat, capital shifts into tobacco stocks or T-bills. Third, the best-behaved pairs get picked by trailing return-per-drawdown and scaled back when volatility spikes. Out of sample from 1995 to 2025, the full stack lifts the Sharpe ratio from 0.56 to about 1.0 while cutting the worst drawdown from 57% to 22%.
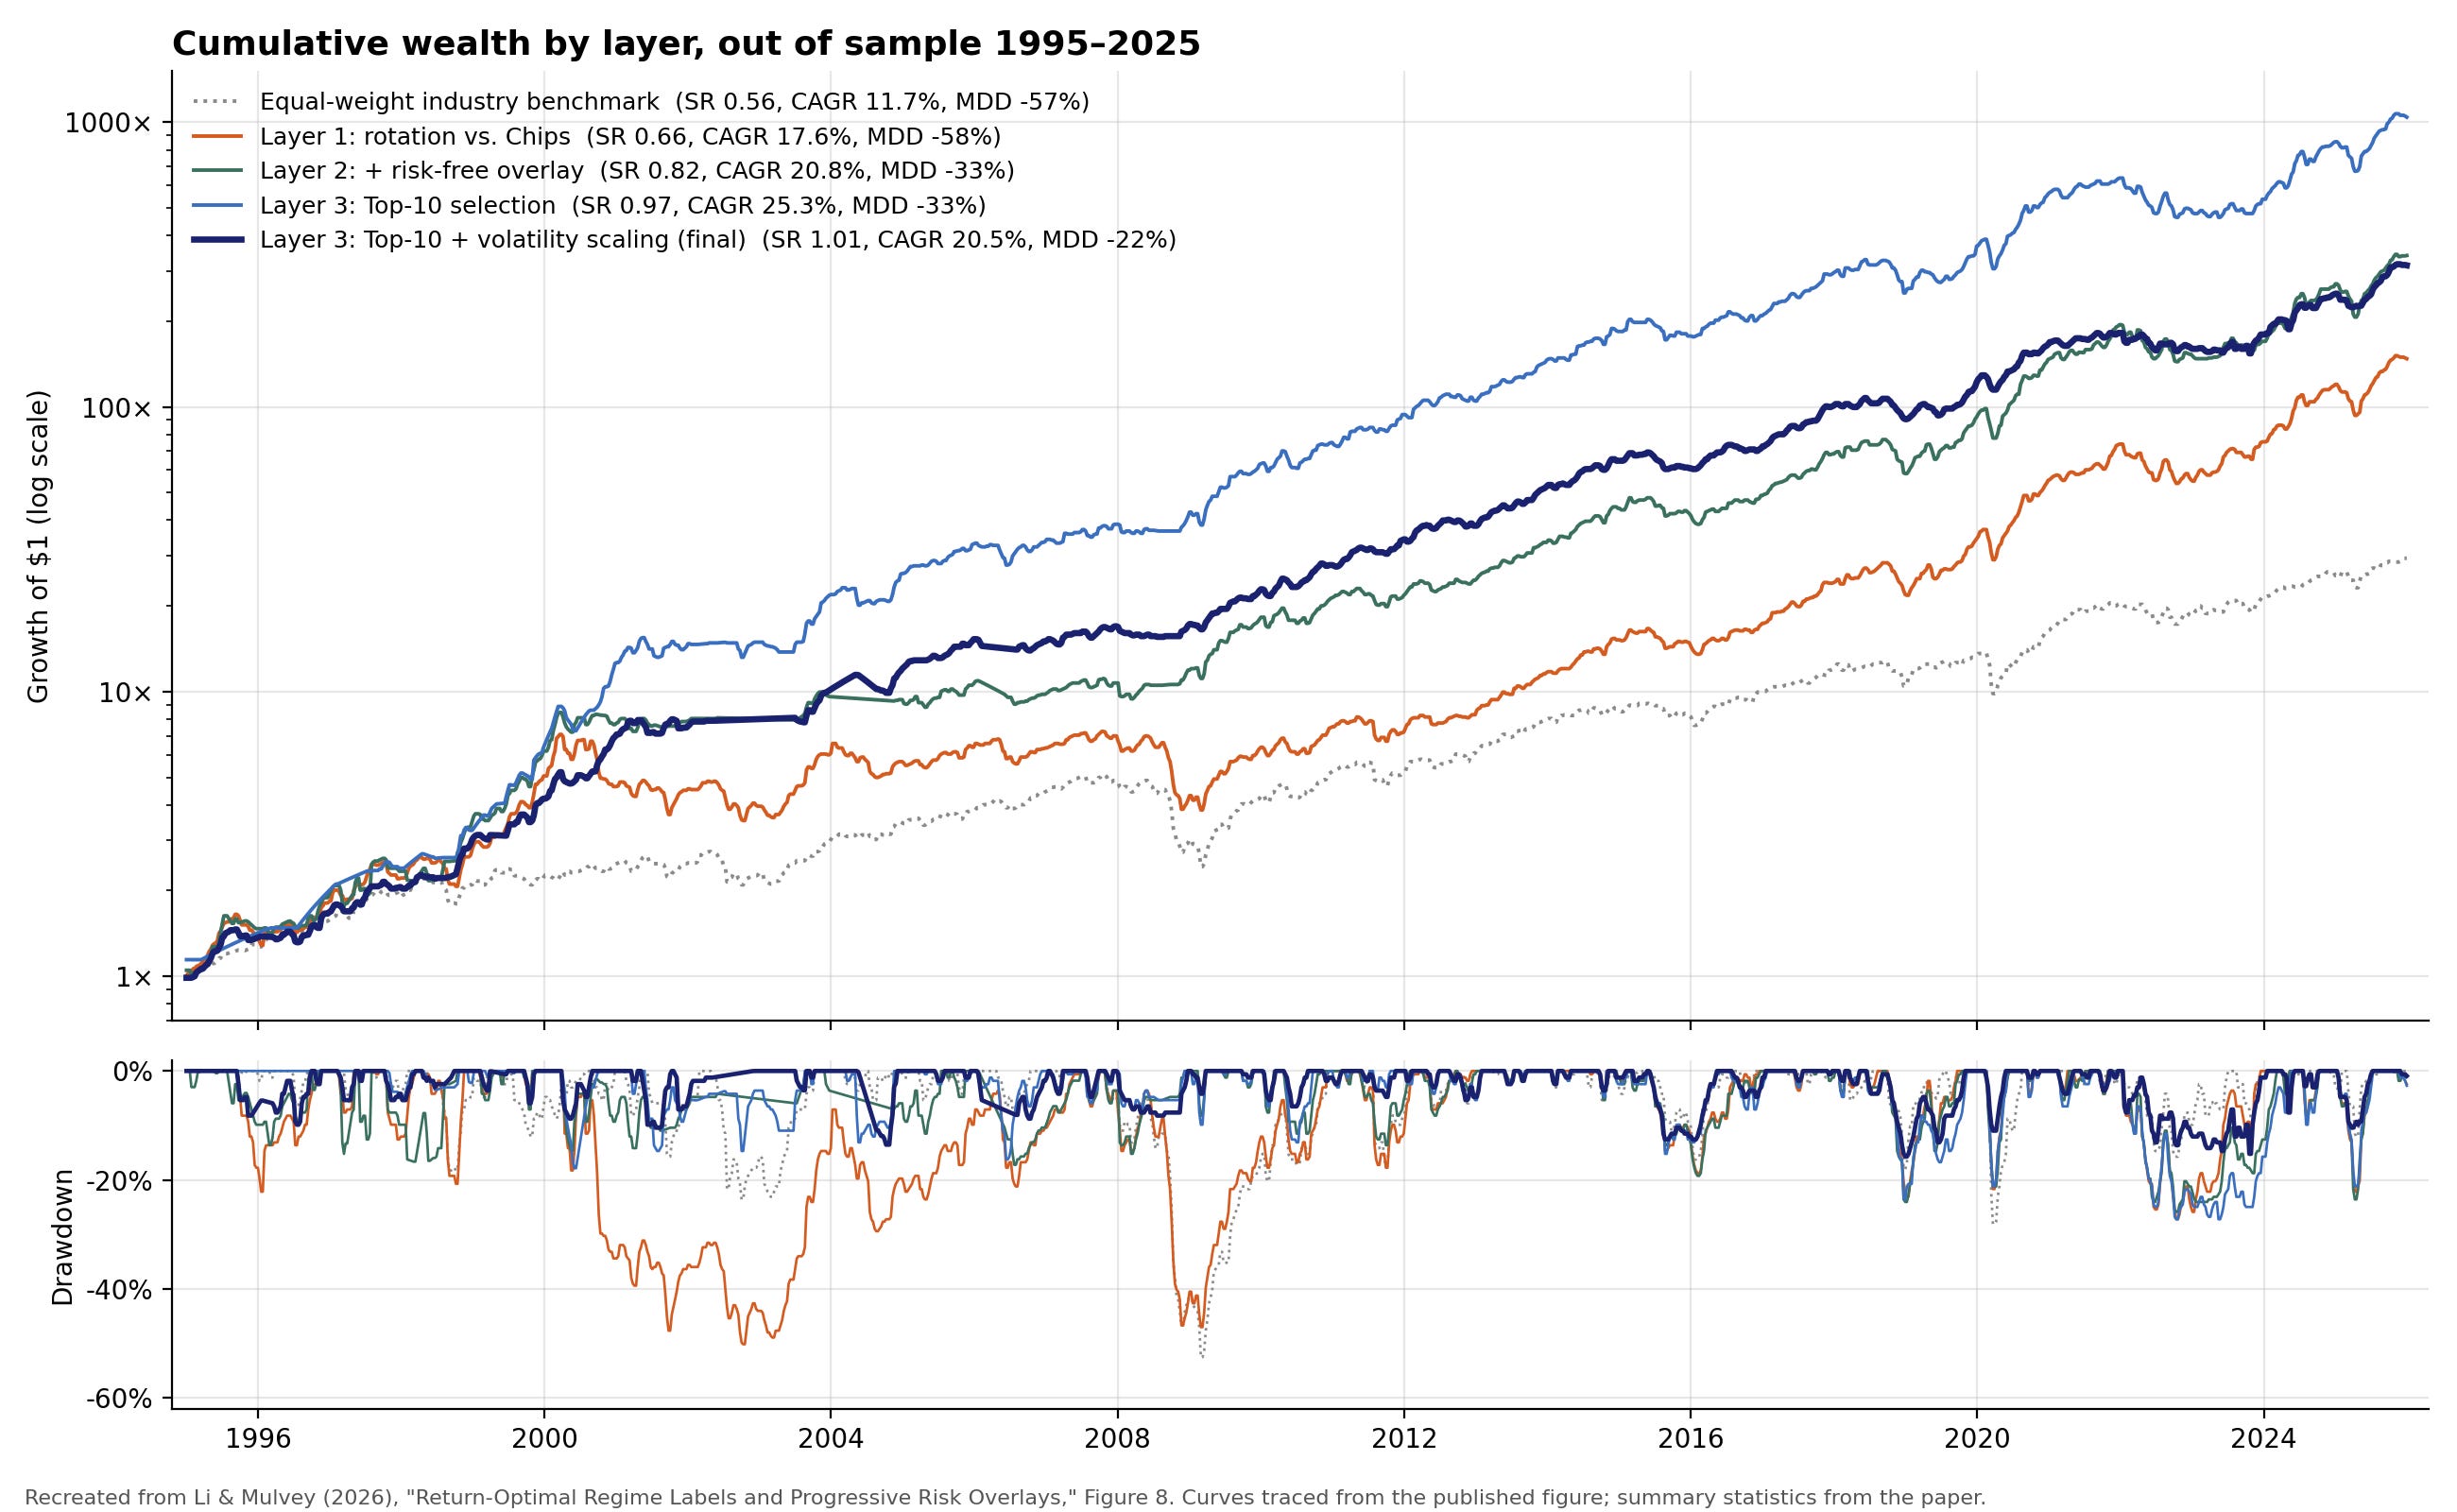
Figure 1: Cumulative wealth and drawdowns, 1995 to 2025, adding one layer of the strategy at a time. The defensive overlay does most of the work in 2000 to 2003 and 2008. Recreated from Li and Mulvey (2026), Figure 8.
The part that is most interesting is the head-to-head. Run the identical pipeline with classical hidden Markov labels and the defensive layer actually hurts. The labels, not the machinery, carry the result. This study argues that “regime” should mean “what you would have done,” and that a clean crash exit matters more than picking the right sector.
Li, Silu and Mulvey, John M., Return-Optimal Regime Labels and Progressive Risk Overlays: A Hierarchical Framework for Industry Allocation. Available at SSRN: https://ssrn.com/abstract=7434978 or http://dx.doi.org/10.2139/ssrn.7434978
The Geometry of a Turning Point
A rule that ignores price levels and asks only whether today's trading range fits inside yesterday's lands far from a random walk in nearly every market tested.
Most turning point detectors flatten a daily candle to a single closing price. Liu keeps the whole range, low to high, and asks a simpler question: How often does one day’s range nest entirely inside the previous day’s (or the reverse)? If prices followed a pure random walk, the answer is a fixed constant, about one day in five, and it doesn’t move with volatility or drift. That gives a clean benchmark to test against.
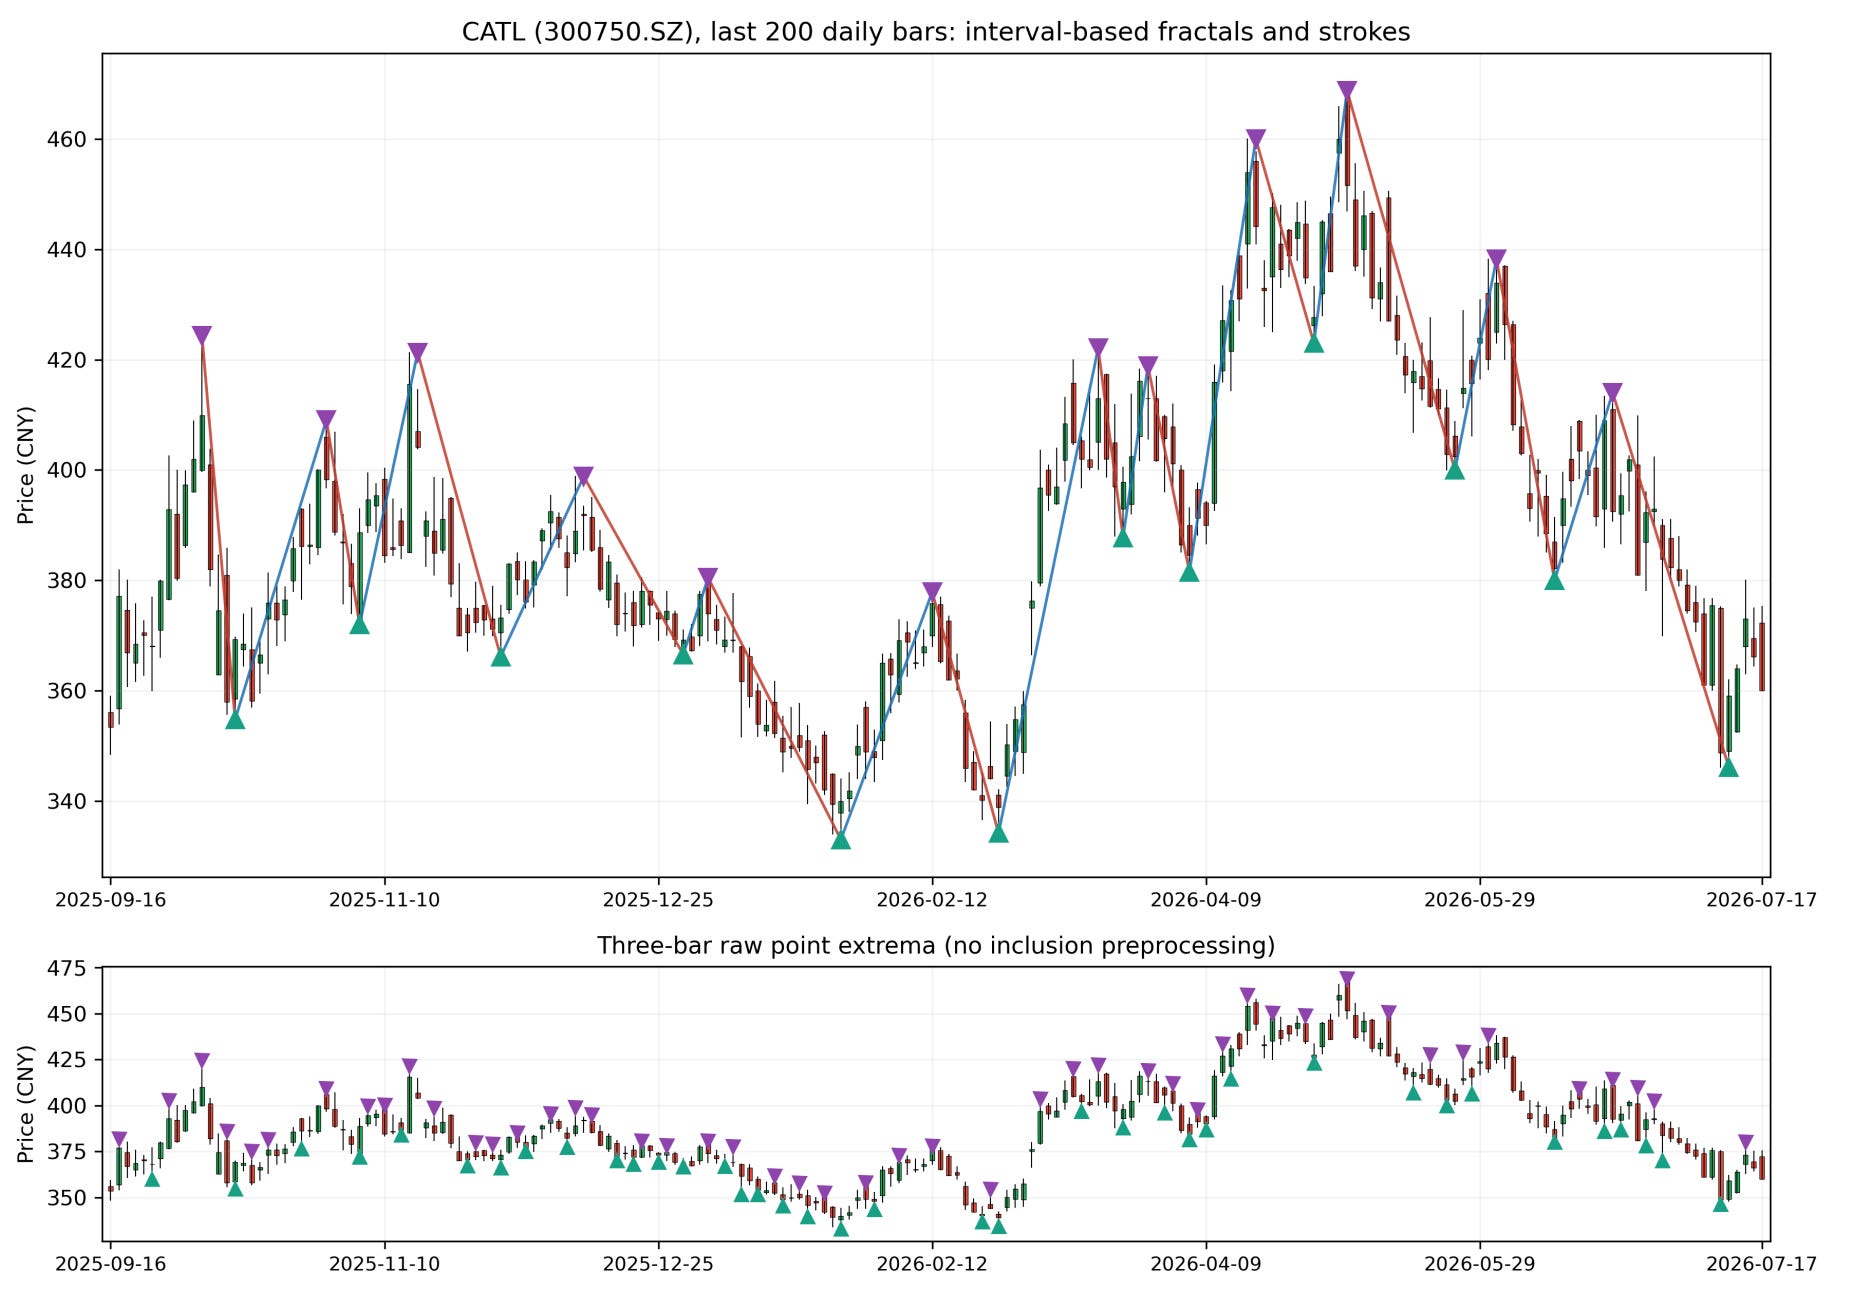
Figure 2: Same stock, same 200 days. Top: turning points after nested candles are merged and short swings filtered. Bottom: every three-bar high and low. Source: Liu (2026), Figure 4.
Across seven asset classes, US and Hong Kong stocks nest at roughly double that rate, currencies and crypto sit well above it, and only broad equity indices land on the random walk value almost exactly. The annoying part is that the usual suspects don’t explain the gap.
Volatility clustering, jumps, and stochastic volatility barely nudge the number, and the author concedes the paper is “leaving open which features of the data-generating process generate it.” For traders, the immediate payoff is the extrema detector itself: No lookback window to tune, no smoothing, and turning points that fall on actual highs and lows. The bigger message is that the shape of daily ranges carries structure that return-based models miss, and it shows up most where individual stocks trade.
Liu, Xinyong, Price Overlap Rate III: Calibration-Free Geometric Local Extrema in OHLC Interval Sequences (August 30, 2026). Available at SSRN: https://ssrn.com/abstract=7415218 or http://dx.doi.org/10.2139/ssrn.7415218
DeFi Interest Rates Follow the 10-Year Treasury
Interest rates on DeFi stablecoin loans track the U.S. 10-year Treasury yield, and the link runs through how heavily the lending pools get used.
Aave is the biggest lending protocol in crypto, and its loans look nothing like a bank’s. No maturity date, everything overcollateralized, and rates set by a formula that reacts to how much of each pool is borrowed out. You would expect those rates to live in their own world. Spoiler, they don’t.
Using daily data from January 2023 to March 2026 across 28 pools, Bhambhwani finds that borrowing and deposit rates on USDC, USDT and DAI move with Treasury yields, and the 10-year does most of the work once every maturity sits in the same regression. A one standard deviation rise in the 10-year lifts stablecoin borrowing rates by roughly 1.1 percentage points.
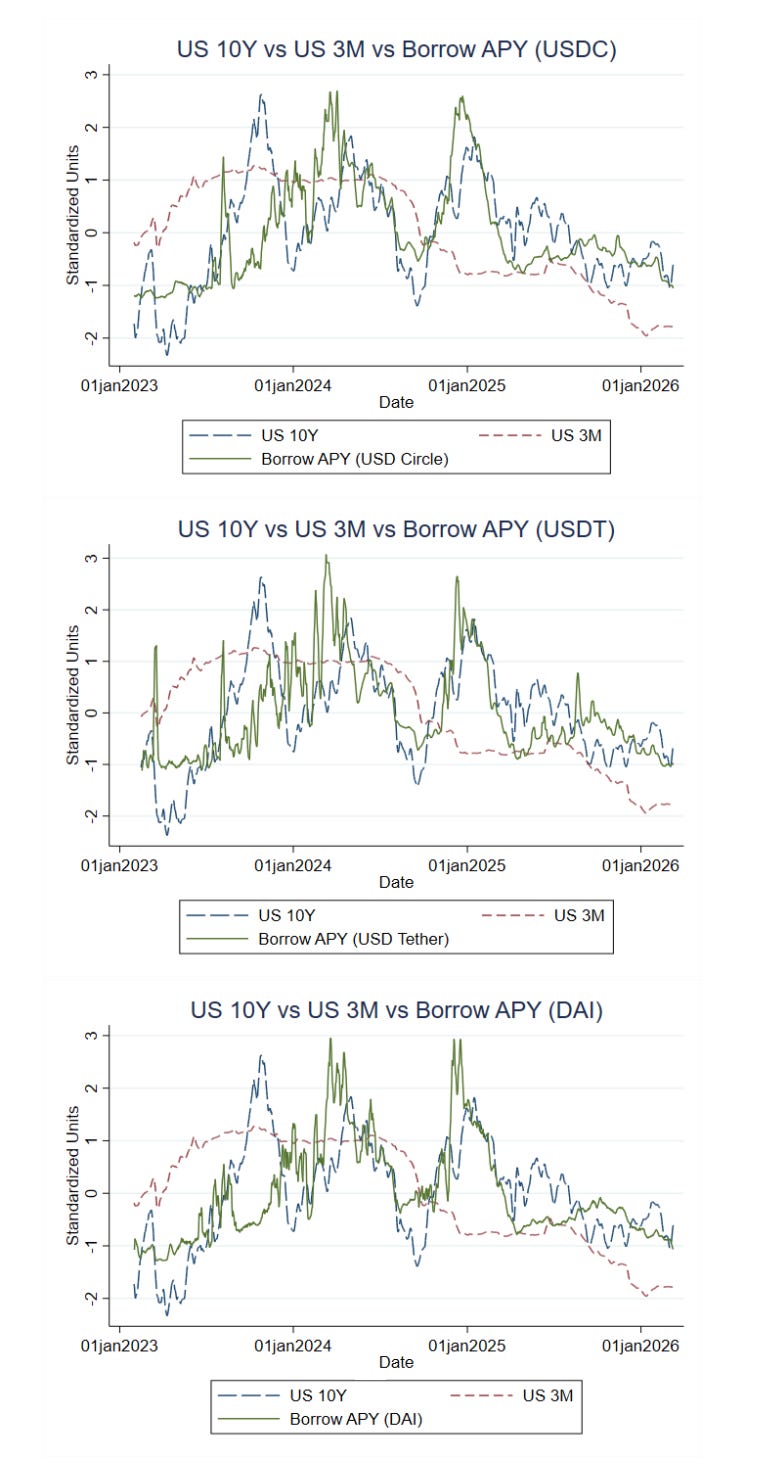
Figure 3: Aave's USDC borrowing rate alongside the U.S. 10-year and 3-month Treasury yields, January 2023 to March 2026. Each series is standardized and smoothed with a 7-day rolling average. Source: Bhambhwani (2026), Figure 1.
The mechanism is neat, with higher Treasury yields pulling up borrowing faster than deposits, so pool utilization climbs and Aave’s rate formula does the rest. Ethereum and Bitcoin pools show no such link, which makes sense, since most people don’t park ETH in a lending pool to compete with bond yields. The author’s read is that stablecoin rates are “not detached from traditional financial markets.” For anyone earning yield on stablecoins, the bond market is now part of the forecast.
Bhambhwani, Siddharth, DeFi Interest Rates and Treasury Yields (July 31, 2026). Finance Research Letters, volume 111, 2026[10.1016/j.frl.2026.110678], Available at SSRN: https://ssrn.com/abstract=7387780 or http://dx.doi.org/10.2139/ssrn.7387780
Herding in Green Hydrogen Stocks: Falling Markets, Liquidity, and the Hormuz Shock
Hydrogen stocks only herd when they are falling, and a real oil-supply shock makes them scatter instead.
Seventeen pure-play hydrogen stocks (electrolyser and fuel-cell makers, with the diversified giants stripped out) look calm on average. Across the full 2018 to 2026 sample, there is no statistical sign that investors copy each other. Condition on what the market is doing and the picture changes.
On down days, however, returns bunch together far more than the size of the move justifies, with the classic herding signature and the same crowding shows up during the acute phase of the Russia-Ukraine war and faintly during the first Covid months. The point made is loss aversion. When the transition story wobbles, holding a divergent position feels expensive, so people sell what everyone else is selling.
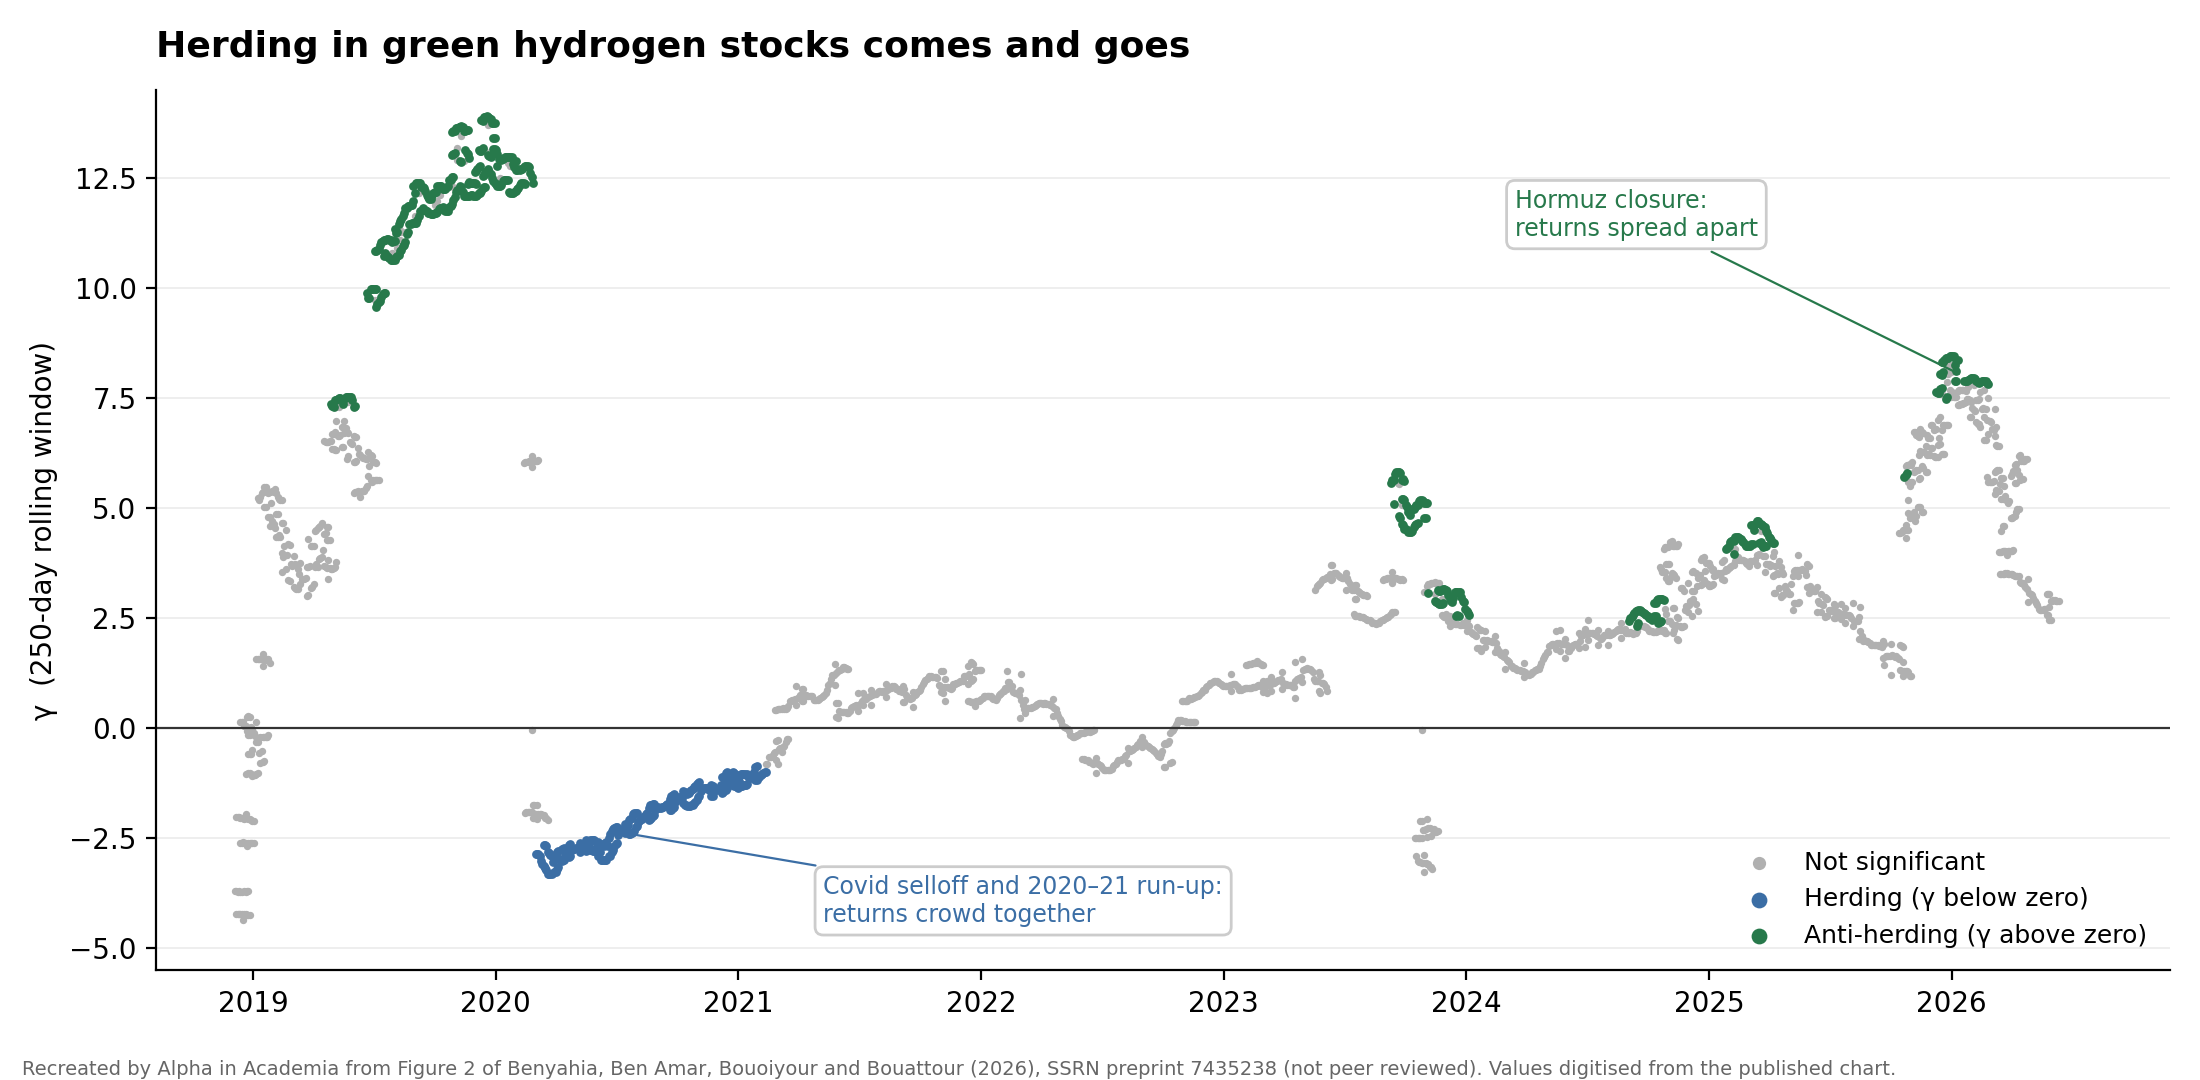
Figure 4: Herding in hydrogen stocks is a mood, not a habit. Each dot is the herding coefficient (γ) estimated over a trailing 250-day window. Recreated from Figure 2 of Benyahia, Ben Amar, Bouoiyour and Bouattour (2026), “Do Investors Herd in Green Hydrogen Stocks?”, SSRN preprint (not peer reviewed).
The 2026 Strait of Hormuz closure did the opposite. Dispersion widened, driven almost entirely by the American names, where gas-fed fuel-cell firms sit next to pure hydrogen plays and an oil shock hits them in opposite directions. The authors’ warning is that “the diversification sought within a hydrogen basket largely disappears precisely when it is most needed.” Thematic baskets protect you in the wrong states, and supply shocks reward stock picking over the sector bet.
Benyahia, Georges Ali and Ben Amar, Amine and Bouoiyour, Jamal and Bouattour, Mondher, Do Investors Herd in Green Hydrogen Stocks? Market States, Liquidity, and Energy-Supply Shocks. Available at SSRN: https://ssrn.com/abstract=7435238 or http://dx.doi.org/10.2139/ssrn.7435238
This week for paid subscribers
Paid subscribers are getting a look at what happens when a cost-aware dynamic allocation model meets real ETF prices. We reproduce Kolm and Ritter's closed-form result exactly, then run the same machinery walk-forward against a fixed 50/40/10 mix with real trading costs and estimated momentum forecasts. The passive mix wins on return, Sharpe, and drawdown, and a forecast-skill audit explains why: the signals were anti-informative, so the better optimizer just acted on bad information more precisely. Python backtest code included.

Disclaimer: The content provided in this newsletter, "Alpha in Academia," is for informational and educational purposes only. It should not be construed as financial advice, investment recommendations, or an offer or solicitation to buy or sell any securities or financial instruments. Past performance is not indicative of future results. The financial markets involve risks, and readers should conduct their own research and consult with qualified financial advisors before making any investment decisions.
The interpretations, opinions, and analyses presented herein are those of the author and do not necessarily reflect the views of the original researchers, their institutions, or the full implications of the cited academic papers. While every effort is made to accurately represent the research discussed, readers should be aware that the summaries and interpretations may not capture the full scope or nuances of the original studies. The information contained in this newsletter is believed to be accurate and reliable at the time of publication, but accuracy and completeness cannot be guaranteed. The author and publisher accept no liability for any loss or damage resulting from reliance on the information provided.
This newsletter may contain links to external websites or resources. The author is not responsible for the content, accuracy, or reliability of these external sources.
By subscribing to or reading this newsletter, you acknowledge that you have read and understood this disclaimer and agree to hold the author and publisher harmless from any liability that may arise from your use of the information contained herein.