
Recent Academic Research
This week’s best academic research on the financial markets

Welcome back to another issue of Recent Academic Research! There were lots of good papers this week. I have highlighted a few others at the bottom of the post. Let’s get into it.
Overpriced Structured Products
The small stated protection in complex products leads individual investors to overpay, subsequently earning them lower returns.
Hong Kong’s Callable Bull/Bear Contracts (CBBCs) are complex structured products largely traded by individual investors. The authors’ core finding reveals a significant and previously less noticed behavioral bias called “overpaid protection,” confirming that investors are willing to pay a premium for perceived safety.
CBBCs include an explicit downside feature known as the residual value, which acts as a small safety net if the product is knocked out before maturity. Analyzing contract data, researchers found a robust, inverse relationship: when the stated protection (residual value) is higher, investors bid up the CBBC prices, resulting in significantly lower daily returns for those who buy them.
By effectively cutting off the perceived worst outcomes, this protection increases expected return skewness (a measure of tail risk). This “overpaid protection” phenomenon provides an alternative explanation for the long-observed tendency for assets with high skewness to deliver poor future returns, a tendency traditionally attributed solely to the “lottery effect” (overpaying for extreme upside).
Li, Gang and Zhang, Chu, Overpaid Lottery and Overpaid Protection: Evidence from Retail Structured Products (October 11, 2025). Available at SSRN: https://ssrn.com/abstract=5594170 or http://dx.doi.org/10.2139/ssrn.5594170
Cross-Firm Momentum
Firms that garner high attention from analysts and media tend to predict the returns of smaller, peer firms.
In emerging markets like China, traditional cross-firm momentum strategies, where the returns of connected peer stocks predict a firm’s future movement, often falter due to messy information flow. This research cuts through the noise by defining stock “leaders” using a novel metric: Strength Centrality (SC).
SC measures a firm’s overall connectedness and influence within the shared analyst coverage network, identifying those drawing disproportionate attention from both analysts and institutional investors. High-SC stocks correlate with desirable traits like larger size and institutional ownership. When weighting peer returns using SC, the resulting momentum factor (CFRetSC) exhibits robust predictive power, achieving statistically significant annual returns that outperform all conventional measures, especially when calculating value-weighted returns.
The underlying source of this power is directional: the effect works robustly from high-SC leaders to low-SC laggards, generating profitable momentum spreads in that direction. The paper highlights: “More importantly, we document a clear directional effect: cross-firm momentum spreads from high-SC leaders to low-SC laggards, with no evidence of reverse spillovers”.
Mao, Yang-Rong and Shi, Huai-Long and Chen, Huayi and Chen, Huayi and Wan, Yu-Lei and Wan, Yu-Lei, Detecting Cross-Firm Momentum Effects Via Shared Analyst Coverage: The Role of Leaders (October 10, 2025). Available at SSRN: https://ssrn.com/abstract=5587812 or http://dx.doi.org/10.2139/ssrn.5587812
Relationships Between Moments
Is market anxiety asymmetric? New data from China shows investors react to bad news via implied volatility, but anticipate extreme positive results using implied tail risks.
Analyzing high-frequency data from the Chinese CSI 300 and CSI 500 ETF options markets, researchers confirm the dominance of Model-Free Implied Volatility (MFIV), finding it offers superior predictive power for actual future volatility compared to classical metrics.
More importantly, the study systematically reveals distinct asymmetric reactions to market returns in different risk measures. When overall implied volatility is already high (representing market anxiety), negative returns (bad news) have a significantly greater impact than positive returns. This reflects the typical panic effect.
However, when examining implied skewness (tail risk) and kurtosis (fat tails), the asymmetry reverses: the influence of positive returns is more pronounced in high-quantile environments. This suggests that while bad news drives general market fear (volatility), expectations of rare, extreme positive gains drive up the perceived cost of tail and fat-tail risk (skewness and kurtosis).
This pattern is stronger in the small and mid-cap CSI 500 market, signaling its increased sensitivity to lottery-like outcomes.
Meng, Jingjing and Song, Wenjing and Yu, Mei and Qin, Zixuan, Information and Stock Returns: Evidence from High-Frequency Data in China’s ETF Options Market. Available at SSRN: https://ssrn.com/abstract=5592637 or http://dx.doi.org/10.2139/ssrn.5592637
Vol of Vol
The Volatility of Volatility Index (VVIX) is a composite measure, driven by both short-term market panic and long-term risk expectations.
For years, the VVIX, often dubbed the “fear of fear” index, was treated primarily as a measure of the volatility of volatility (VOV), but new research reveals it contains a second, equally critical component: Long-Run Variance (LRV).
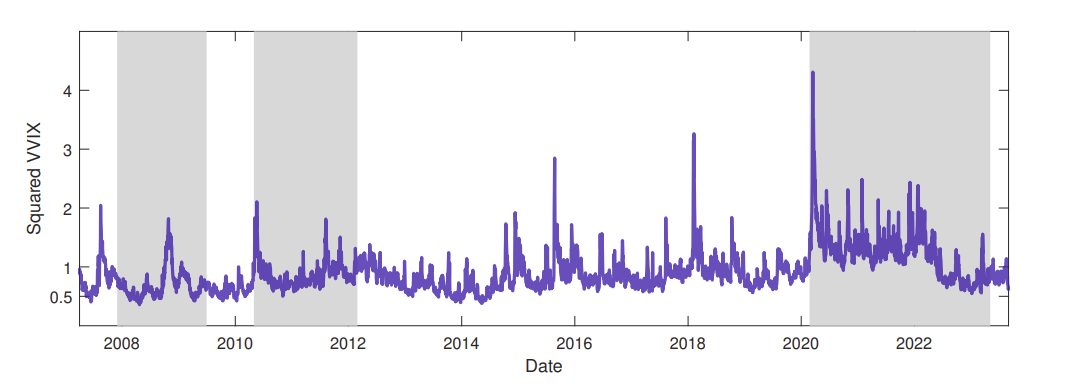
Using a sophisticated model and leveraging a novel technique involving risk-neutral cumulant data extracted from VIX options, researchers decomposed the VVIX dynamics. Their analysis reveals that the factors driving the index change dramatically depending on market conditions. Specifically, the short-term panic measure, VOV, significantly contributes only during acute periods of financial distress, which aligns with intuition. However, during stable or bull markets, the VVIX is primarily driven by the LRV component, reflecting persistent, underlying risk expectations.
In fact, when testing the explanatory power on market-neutral straddle portfolios using S&P 500 options, combining LRV and VOV produced an adjusted explanatory power up to three times greater than baseline models. The finding shows that the index provides “a clear answer to the question of the informational content of the VVIX, showing that it reflects not only the VOV but also an additional important component—the LRV”. Investors should thus view the VVIX not just as a fear gauge, but as a dual-sensor monitoring immediate market stress and long-term risk.
Bacon, Étienne and Bégin, Jean-François and Gauthier, Geneviève, Beyond volatility of volatility: Decomposing the informational content of VVIX (October 15, 2025). Available at SSRN: https://ssrn.com/abstract=5611090 or http://dx.doi.org/10.2139/ssrn.5611090
Other Papers This Week
Feedback
Thank you for reading this week’s edition of Recent Academic Research. Remember to fill out the poll to let me know which paper was your favorite and like the post if you enjoyed it.
Feel free to follow up with any questions, comments, or ideas for the future!
Disclaimer
The content provided in this newsletter, "Alpha in Academia," is for informational and educational purposes only. It should not be construed as financial advice, investment recommendations, or an offer or solicitation to buy or sell any securities or financial instruments. Past performance is not indicative of future results. The financial markets involve risks, and readers should conduct their own research and consult with qualified financial advisors before making any investment decisions.
The interpretations, opinions, and analyses presented herein are those of the author and do not necessarily reflect the views of the original researchers, their institutions, or the full implications of the cited academic papers. While every effort is made to accurately represent the research discussed, readers should be aware that the summaries and interpretations may not capture the full scope or nuances of the original studies. The information contained in this newsletter is believed to be accurate and reliable at the time of publication, but accuracy and completeness cannot be guaranteed. The author and publisher accept no liability for any loss or damage resulting from reliance on the information provided.
This newsletter may contain links to external websites or resources. The author is not responsible for the content, accuracy, or reliability of these external sources.
By subscribing to or reading this newsletter, you acknowledge that you have read and understood this disclaimer and agree to hold the author and publisher harmless from any liability that may arise from your use of the information contained herein.