

Reviewed and updated 24 July 2026
Hello and welcome back to another paid post!
Today we will take a look at how intraday trading volume follows predictable daily patterns, and how a simple statistical trick can use those patterns to execute trades more efficiently.
Let’s dive right in.
The Problem with Volume Forecasting
Intraday equity volume follows a predictable, U-shaped pattern, yet most forecasting models either ignore this curve or hardcode a functional form. If you want to execute a large equity order with minimal market impact, you need to know when the market is liquid. Executing 500,000 shares of INTC at 11am looks very different from the same order at 3:55pm. The first hits a thin market; the second catches the closing auction at peak liquidity. Getting this timing wrong costs real money in slippage and market impact.
The tool of choice for managing this is Volume-Weighted Average Price (VWAP) execution (breaking a large order into smaller clips timed to align with predicted volume). VWAP strategies require volume forecasts at the 5-minute interval level, throughout the trading day.
The core challenge is that intraday volume is not stationary. It has a strong deterministic periodic component that repeats every trading day. The U-shaped curve (high volume at the open and close, a trough around midday) is the textbook pattern, first documented by Admati and Pfleiderer (1988) and Jain and Joh (1988). But empirical reality is messier. Some stocks show J-shapes, where morning activity is subdued relative to the close. Others have W-shapes, multimodal distributions, or significant variation across regimes.
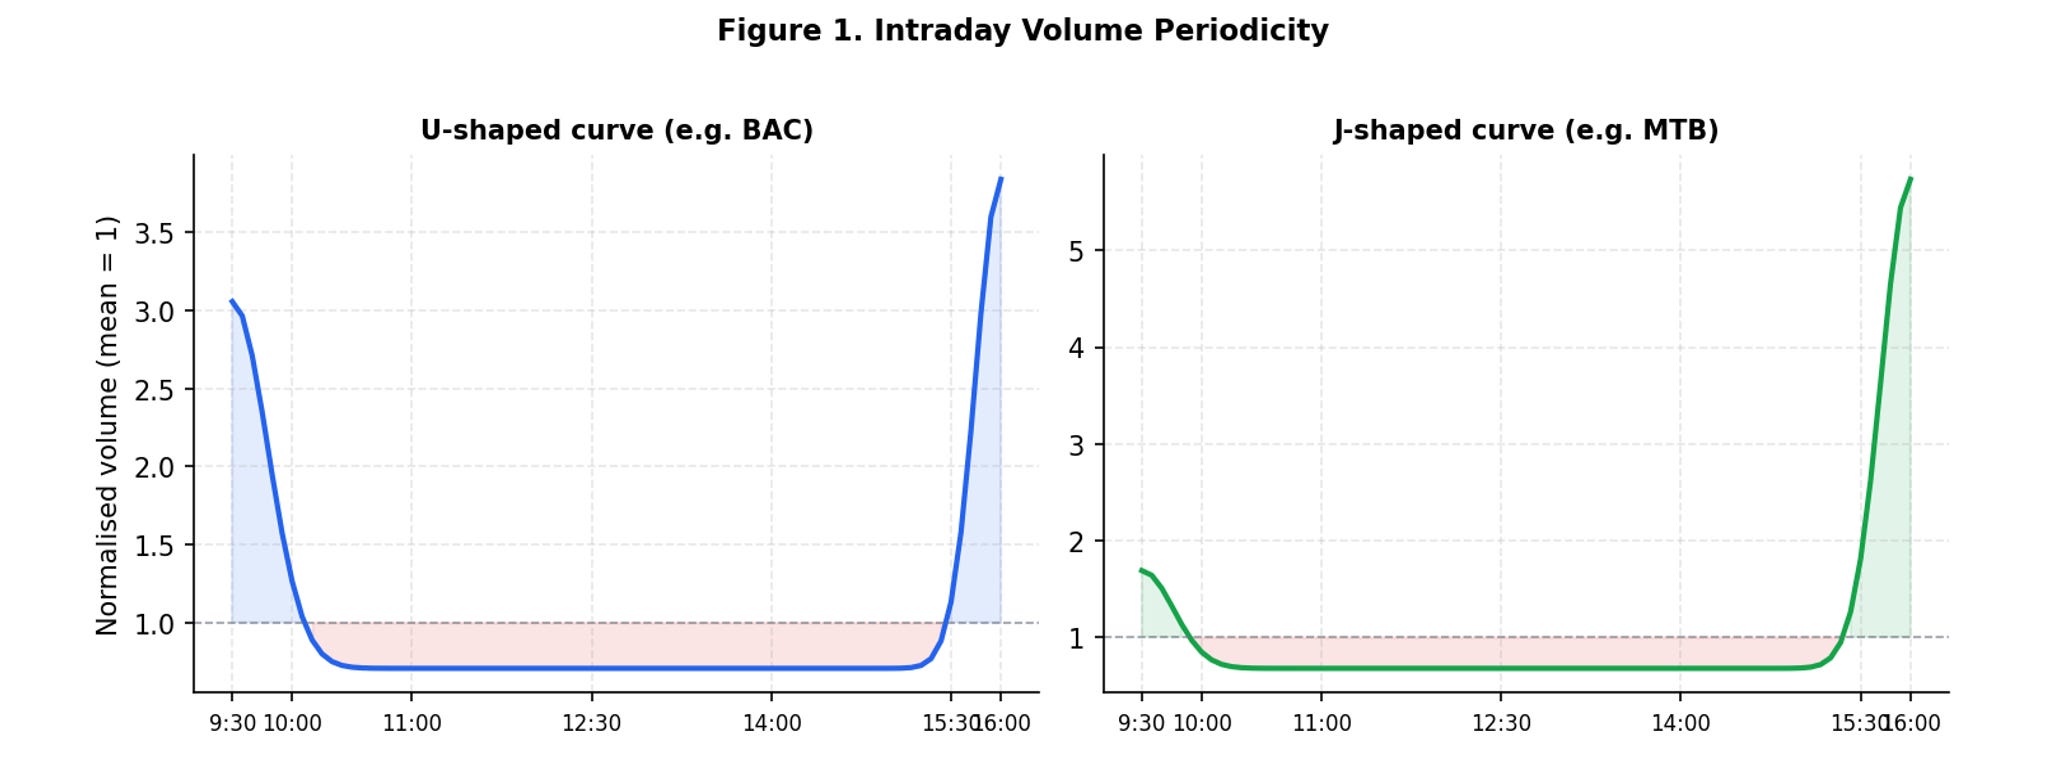
Figure 1. Stylized intraday volume periodicity. Left: classic U-shape (high-volume liquid stocks). Right: J-shape (back-loaded, common in less actively traded names). Both are normalized to a mean of 1.0 across the trading day.
The standard approach, exemplified by the Component Multiplicative Error Model (CMEM) of Brownlees, Cipollini & Gallo (2011), decomposes volume into daily, intraday, and periodic components, but it requires specifying the functional form of the periodic curve in advance. If you assume a U-shape and the stock trades in a J-shape, your forecast is structurally misspecified from the start.
The SPAR Approach: Demean and Regress
The SPAR model reframes periodicity not as something to model, but as something to remove. The key insight is that intraday trading volume, viewed across multiple days at the same time of day, looks like a panel dataset. Each 5-minute bar index k plays the role of an individual in a panel regression; each trading day t plays the role of an observation.