

Reviewed and updated 20 July 2026
Hello!
Welcome back to another market investigation post. This post will showcase the creation of the volatility smile, volatility term structure, and volatility surface for stock and ETF options.
This post builds off of my post last week, where we explored basic option pricing models and the option Greeks. The creation of the volatility surface is the first step in exploiting opportunities that were found in various academic papers.
A research companion for paid members is available below.
Let’s get into it.
Introduction
Today, I will be showcasing the construction of the volatility smile, volatility term structure, and volatility surface for stock and ETF options. I appreciate the support from last week’s post, and I wanted to spend time developing a IV surface that you all can play around with.
Every stock and ETF that has an options chain has an IV surface. However, most platforms and brokers do not provide these visualizations directly. From my knowledge, most institutional traders and investors that trade volatility use commercially available data and visualizations (Vola Dynamics, Bloomberg, etc.) instead of replicating their own IV surface.
Why do they do this? Well, there are plenty of challenges in constructing your own IV surface, especially for illiquid option chains. Additionally, data can be difficult to get for many options chains. Today, we will be sticking with stocks and ETFs that have very liquid and highly traded option chains. This website is a useful resource in determining the stock / ETF that you want to use for constructing the volatility surface. Since SPY has the most volume, we will be using that as an example today. The research companion makes the ticker and expiry window configurable, but another stock or ETF can still require different liquidity filters, dividend assumptions, and contract treatment.
The volatility surface and other visualizations that you see below should all be taken with a grain of salt due to the limitations in creating a volatility surface from scratch. For example, SPY options are American-style. European put-call parity does not apply unchanged because early exercise and dividends can matter. This can affect implied-volatility estimates from a simplified European model.
Additionally, the SPY ETF pays dividends, and future cash dividends require an assumption or forecast. In my attempt to keep the model simple enough for you to edit and play around with, I chose not to include dividend modeling.
We will first explore the creation of the volatility smile on a specific expiration date. Then, we will look at the term structure of IV across expiration dates, and we will subsequently combine these two visualizations to create a volatility surface.
All of these visualizations and calculations were run after market close on March 4, 2025. SPY was down more than 1% that day, and VIX closed at about 23.5.
Volatility Smile
After loading in relevant python packages, I imported option price data from Yahoo Finance. As stated above, we will be focusing on SPY options for this investigation.
Once we have the data, we should select an expiration with enough trading activity to support a useful visualization. Volume and open interest can help identify active expirations, but neither guarantees that an option’s latest trade or displayed quote is current or close to fair value. Bid-ask width, quote timestamps, and a valid two-sided market are more direct checks.
In order to do this, I compared volume and open interest across the available expiration dates. The output is pasted below:
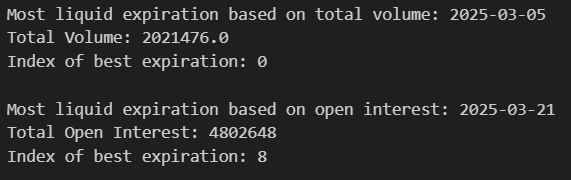
I’ve been using this for a little while now, and it seems like the expiration date with the most volume is always the expiration date that is closest to today. This makes sense, as market participants are changing their positions before the options expire.
However, the option values are greatly influenced due to the expiration date being so close. I will list a few ways that option values and Greeks change as the expiration date becomes near.
Implied volatility does not mechanically decline as an option approaches expiration. Time value decays, but the annualized implied-volatility estimate can rise or fall with supply, demand, event risk, quote quality, and the pricing model. Very short-dated estimates are also especially sensitive to stale prices and small pricing errors. Veta describes how an option’s Vega changes as time passes; it does not measure how implied volatility itself changes with time.
Additionally, options with shorter expirations can experience faster Theta decay as their remaining time value converges toward zero. Delta also changes as time passes, a sensitivity described by Charm. Delta is often used as a rough moneyness proxy, but it is not literally the probability of expiring in the money. In the basic Black-Scholes framework, call Delta is N(d1), while the model’s risk-neutral in-the-money probability is associated with N(d2).
For these reasons (and a few more), we do not want to build the smile from options that expire tomorrow. We still want a reasonably active expiration, so this analysis uses the date with the highest open interest. Open interest is the number of outstanding contracts. It is an activity indicator, not proof that the latest price is current or accurate; a careful analysis should also inspect two-sided quotes, spreads, and timestamps.
For the volatility smile, we will use March 21, 2025, which had the highest open interest in this historical snapshot. Those who have been paying attention to prior posts will see that this is the third Friday of the month. In the calendar effects investigation, we saw how options commonly expire on the third Friday of every month. These standard monthly expirations often attract more trading activity. In the research companion's optional current-data mode, the `--min-days`, `--max-days`, and `--max-expiries` controls define the expiration window and number of expirations included.
Vol Smile with Yahoo Finance Implied Volatility Data
Yahoo Finance actually provides implied volatility estimates in its data. While the rest of the code and post will showcase implied-volatility values calculated with the Black-Scholes model, I was interested in comparing them with Yahoo's values. I do not know exactly how Yahoo derives its estimates, so I will calculate a separate model-based series after this.
Here is the IV smile for our selected expiration date.
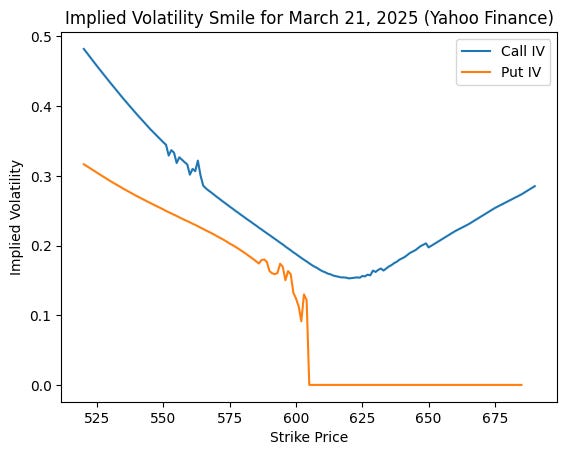
Interestingly, the call IV values are quite smooth. However, the deep ITM put series falls to zero, which should be treated as missing or unusable rather than economically meaningful. Thin trading and stale or incomplete inputs are likely contributors.
In this snapshot, call volatility is lowest for calls that are slightly OTM. The separate call and put smile charts also show higher IV on the low-strike side. Because quote timing and liquidity can materially affect these values, I treat the chart as a descriptive snapshot rather than a fair-value test.