
Treasury Auctions and Future Returns
The impact of the bid-to-cover ratio on the U.S. Treasury Market

Hello!
Welcome back to another post. Today, I will be exploring how the success of a Treasury auction relates to market returns across Treasuries.
Specifically, I will be looking at a common metric, the bid-to-cover ratio, and its impact. Spoiler: the clean nominal-auction sample contains a few short-horizon associations, but it does not support a reliable broad forecasting rule.
This topic has been investigated across various academic papers, and we will showcase a few of the findings from these papers as well. Let’s get into it.
Reviewed and updated 26 July 2026
Treasury Auctions and Bid-To-Cover Ratio
Before we get into the analysis, I want to explain how Treasury Auctions are conducted and what Bid-to-Cover ratios are.
The U.S. Treasury funds government operations by selling debt securities to the public. Since 1998, marketable Treasury securities have been sold through a single-price auction, often described as a uniform-price or Dutch auction: every successful bidder receives the same stop-out rate.
Primary dealers are expected to bid on a pro-rata basis in Treasury auctions at reasonably competitive prices. The broader bid book still matters because it shows how much demand was submitted relative to the amount offered.
To measure the strength of this demand, we look at the Bid-to-Cover (BTC) Ratio. The BTC ratio is a simple calculation: the total dollar volume of bids received divided by the dollar volume of securities sold.
A high BTC indicates more bids relative to the amount offered, suggesting stronger demand at that auction.
A low BTC indicates fewer bids relative to the amount offered, suggesting weaker demand at that auction.
In the clean nominal fixed-rate sample, average BTC is 2.71x for the 2-year note and 2.33x for the 30-year bond. That difference is why I compare each auction with the history of its own maturity.
I categorize an auction as “weak” if it falls into the bottom 20th percentile of its own maturity’s history. This keeps the comparison within maturity instead of applying one threshold across the yield curve.
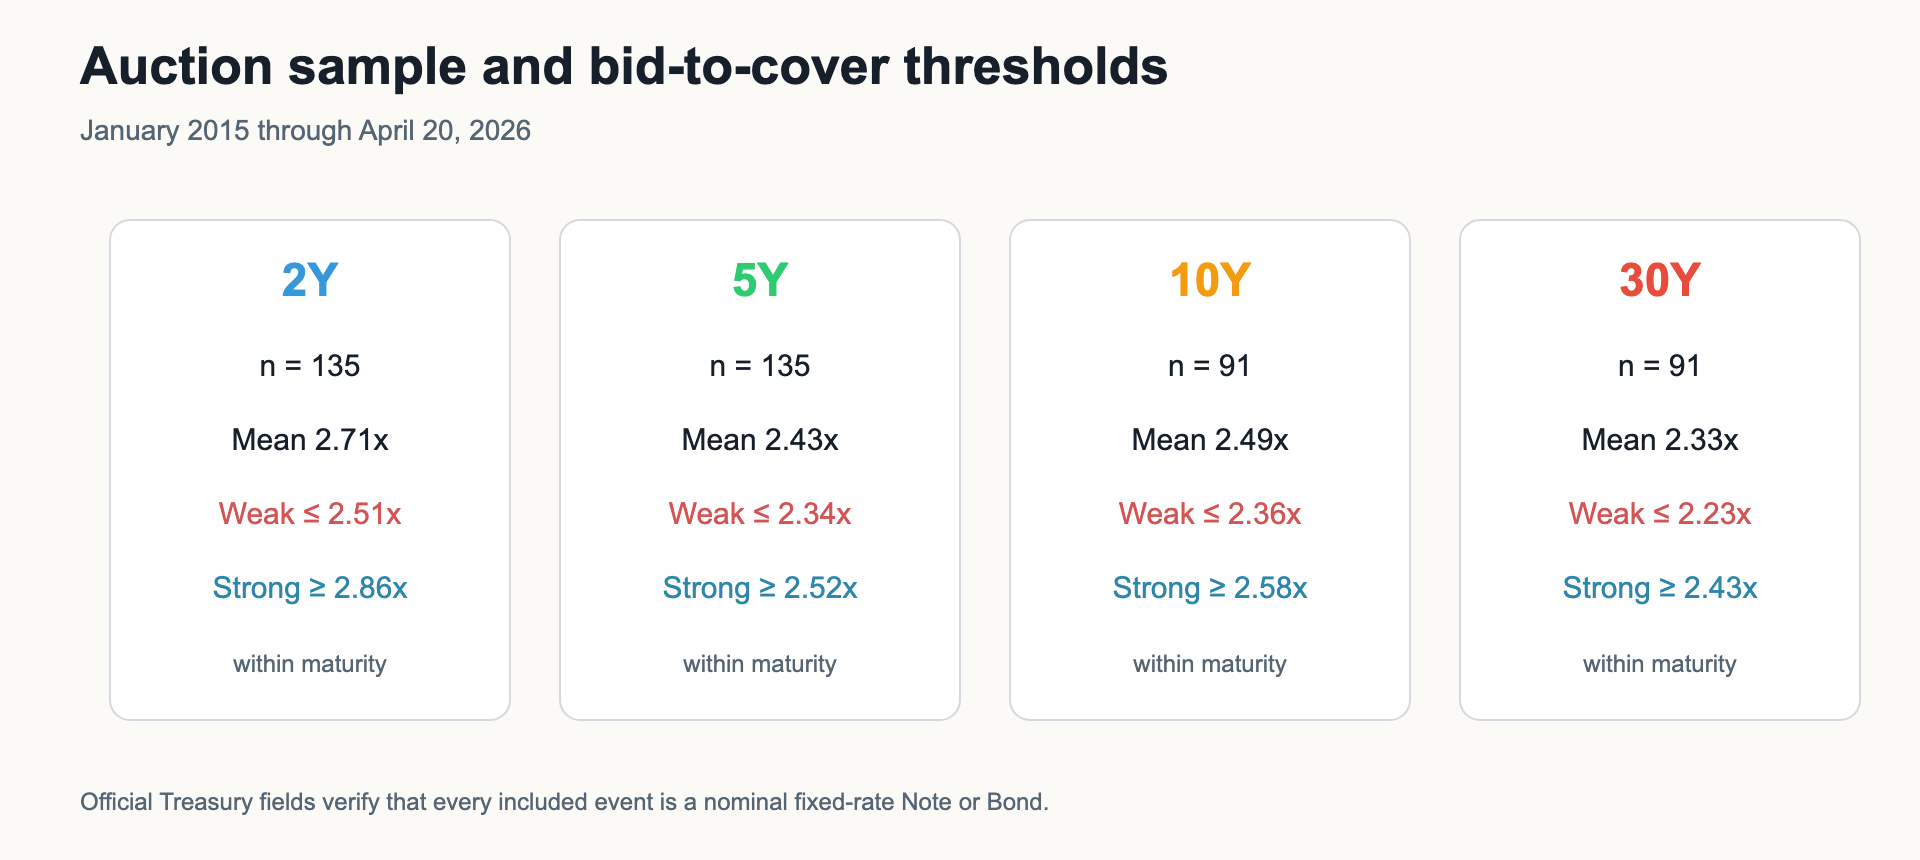
The clean sample contains 135 2-year, 135 5-year, 91 10-year, and 91 30-year auctions. Floating-rate notes and TIPS are excluded; qualifying nominal fixed-rate reopenings are included.
The weak and strong thresholds are calculated separately within each maturity using the full sample. They are descriptive sample ranks, not thresholds that would have been available in real time.
Keeping those security types separate avoids comparing bid books for contracts with different structures.
Now, I will look at how BTC ratios relate to Treasury yields.
The Increasing Importance of the BTC Ratio
There is academic research that offers useful context for why auction demand may matter. Two recent papers look at related measures from different angles.
A 2025 study from Harvard Business School (What Treasury Auctions Reveal About Investor Demand)1 found that the Treasury market has become significantly more inelastic since 2010.
The HBS paper estimates that a 1% increase in relative supply was associated with about a 2-basis-point yield increase before 2010 and about a 9-basis-point increase since 2010. That is a nearly fivefold change in estimated demand inelasticity, but relative supply is not the same measure as BTC.
ECB Working Paper No. 2056 models primary dealers as receiving private information from client demand and studies how BTC relates to secondary-market yields in euro-area auctions.
The paper highlights two main findings:
In the euro-area sample, higher relative BTC was associated with lower immediate secondary-market yields.
The estimated association was stronger during periods of high market volatility.
Together, these papers motivate looking closely at auction demand and market responses. They do not directly validate this U.S. event study, because they use different markets and different measures.
Keep reading with a 7-day free trial
Subscribe to Alpha in Academia to keep reading this post and get 7 days of free access to the full post archives.