

Reviewed and updated 20 July 2026
Hello!
This post is a follow up from last week’s post on popular recession indicators. Today, we will look through a paper that claims to find the “perfect” recession indicator through the construction of various forward spreads on the yield curve.
Additionally, I have created a python script that computes these spreads so that you all can use them on your own.
In the next post, we will examine how the market performs over a future period of time as yield curve spreads and other indicators change.
Let’s get into it.
Recap of Last Post
Before diving into the academic search for perfect recession predictors, let’s quickly recap the indicators I covered in the last section and where they fall short.
The 10Y-2Y spread is probably the most well-known yield curve measure out there. When short-term yields exceed long-term ones, the spread inverts (and becomes negative). Historically, it inverts before every recession. However, the timing of the inversion is inconsistent and the lag between inversion and recession can stretch for over a year. It’s also notable that the spread occasionally normalizes before recessions, which can be easy to misread as a sign of recovery.
The 10Y-3M spread tells a similar story. It’s the backbone of a recession probability model by the New York Fed. The NY Fed’s model is not consistent in its timing around a recession (before, during, or after) and the threshold level around each recession varies significantly (with high probabilities also lacking a corresponding recession).
The Near-Term Forward Spread (NTFS) is supposed to be more forward-looking, measuring the difference between expected 3-month yields 18 months out and the current 3-month rate. This spread suffers from the same false positive issue (especially when observed daily) and tends to invert without a recession following soon after.
The Sahm Rule, unlike the others, isn’t meant to forecast recessions far in advance. It triggers when the three-month moving average of the national unemployment rate (U3) rises by 0.50 percentage points or more relative to the minimum of the three-month averages from the previous 12 months. However, it usually triggers after a recession has already started. It’s a great real-time confirmation tool, but not much help if you’re trying to find a leading indicator.
Paper Introduction
The authors of Perfect Recession Predictors, a UIUC professor, a UNC professor, and an economist from the Federal Reserve system, undergo a computationally intensive search for financial indicators that can accurately forecast recessions without any false positives or false negatives. Building on the shortcomings of widely used benchmarks like the 10-year minus 2-year Treasury spread, 10-year minus 3-month spread, and the Near-Term Forward Spread (NTFS) (all of which have repeatedly issued false alarms) the authors define a perfect predictor as one that flags a recession when one occurs within a 12-month horizon, without signaling a recession when none follows.
To formalize this, they define:
A false positive as an inversion (a spread turning negative) that is not followed by a recession within a year.
A false negative as a failure to signal (no inversion) in the 12 months before a recession begins.
Rather than relying on ad hoc maturity choices like prior studies, the authors build a comprehensive dataset using zero-coupon Treasury yields with maturities from 1 to 360 months (30 years) from 1961 to 2023. This yields over 1.6 million possible spreads, including both term and forward spreads. They further enhance these with moving averages spanning 1 to 400 business days, generating over 645 million predictor series. Each was evaluated using a supercomputer with 800 CPUs.
Findings:
The commonly used benchmark spreads perform poorly:
NTFS generated 59 false positives; 10y–2y had 26; 10y–3m had 32.
None missed a recession (i.e., no false negatives), but all had excessive false positives.
The authors discover 83 perfect spreads, which are spreads that predict every recession since 1962 without a single false positive or false negative.
58 of the perfect predictors are forward spreads, not term spreads.
These spreads are generally based on forward rates starting around 4 years ahead, subtracting a 1-month short rate.
The optimal moving average window is about one year (roughly 260 business days).
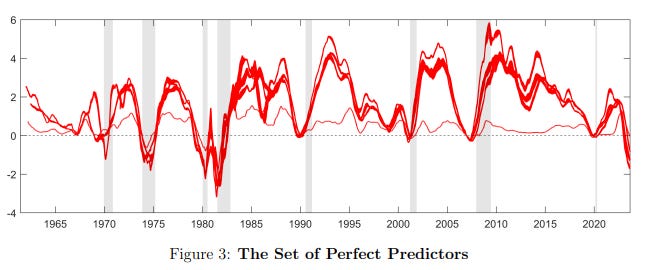
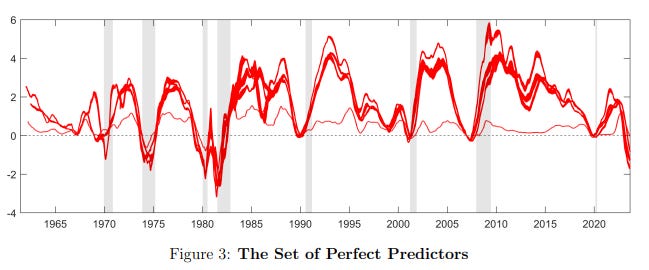
This figure shows the time series of the perfect predictors identified by the authors’ grid search.
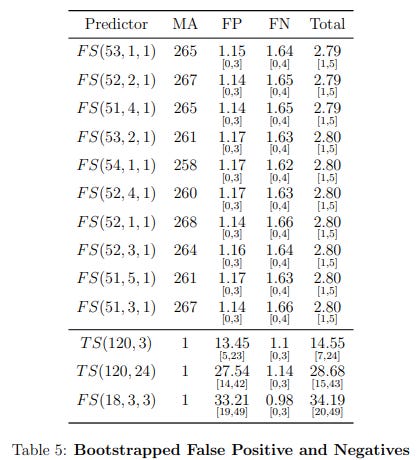
A block-bootstrap exercise tests sensitivity to alternative resampled paths. The selected predictors averaged about 2.8 total mispredictions, compared with roughly 14.6–34.2 for the three benchmark spreads. This is a robustness exercise within the historical sample, not an out-of-sample validation.
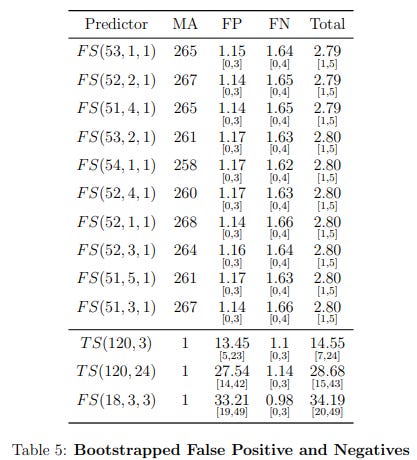
The top panel shows the bootstrap results for the top 10 performing perfect predictors. The bottom panel shows the results for the three benchmark spreads. T S(l, n) and F S(l, m, n) are defined in (3.1) and (3.3). The optimal MA horizon (in number of days) is in the second column when it is relevant. The last three columns present the number of false positives (FP), false negatives (FN) and the sum of the two for each predictor. We present the average calculated across 10,000 bootstrapped samples, and the 90% confidence interval in square brackets below. Aggregating perfect spreads into a single index produces a tool with no false positives or negatives. This “perfect index” sharply rises before each recession and remains low during expansions.
The authors also construct “broad indices” that weight all 1.6 million spreads based on historical performance. When heavily weighted toward top-performing spreads, these broad indices also achieve perfect performance.
Using AUROC (area under the receiver operating characteristic curve), perfect and optimized broad indices consistently achieve a score of 1.00, while common spreads range from 0.63 to 0.69.
A New Keynesian model explains why these perfect predictors work: long-horizon forward spreads with higher term premia are less sensitive to short-term noise and more likely to invert only during genuine downturns.
Moving averages help filter out noise from transitory monetary and productivity shocks, which reduces false signals and strengthens the spread-growth relationship.
These results suggest that both the maturity structure of the spread and the use of smoothing techniques are essential to building recession predictors that are not only statistically impressive but also economically intuitive.
Diercks, Anthony M. and Soques, Daniel and Wu, Jing Cynthia, Perfect Recession Predictors (November 15, 2024). Available at SSRN: https://ssrn.com/abstract=5022493 or http://dx.doi.org/10.2139/ssrn.5022493