

Reviewed and updated 20 July 2026
Hello!
This is the third post in the “Perfect” Recession Predictor series. In this post, we’ll explore future market returns following inversions in the “perfect” forward spread, as well as returns after certain economic conditions.
I’ve also included a research companion that lets you inspect the reported returns and run an updated version of the analysis.
Let’s get into it.
Series Recap
Last week, I introduced a paper that claims to have found the “perfect” recession indicator. The authors searched over 645 million combinations of yield curve spreads using zero-coupon Treasury data, looking for combinations that matched every U.S. recession since 1962 in their sample without a false positive or false negative. Unlike the usual 10Y-2Y or 10Y-3M spreads (which have a history of false alarms), these perfect spreads are mostly forward rates starting about 4 years out minus short-term yields, smoothed over a one-year moving average.
The post also reviewed the more popular recession indicators from the first article (like the 10Y-2Y, NTFS, and the Sahm Rule), and why they fall short, either due to inconsistent timing or poor lead time. I also included a Python script that replicates the perfect spread construction from the paper, so you can build and experiment with your own indicators using the same methodology.
This week, we’ll shift gears a bit and look at how markets behave once those signals trigger.
Introduction
There are two major parts to today’s investigation. First, we’ll look at future market returns following inversions in the “perfect” forward spread.
While we will be using the same forward spread with the 1 year moving average from last week’s post (the 1-month forward, 53 months from now minus the 1 month yield), the code is available to you all. Therefore, you are welcome to play around with different forward spreads.
The S&P 500 is used as a proxy for the market. I sourced this data from yfinance to keep it accessible for subscribers to use the code. I start the market sample in 1990, which leaves only four forward-spread inversions in the investigation.
This is important to keep in mind, as four observations are too few to support a reliable forecasting conclusion.
The market returns are shown across four horizons:
6 Month Future Return
1 Year Future Return
2 Year Future Return
3 Year Future Return
Additionally, we will bucket different economic indicators (GDP Growth, CPI YoY Change, and Unemployment) together and view the future market returns from that.
Forward Spread Inversion and S&P 500 Returns
The first step in this process was to download data from yfinance. I used ^GSPC, as it has more data than ETFs like SPY.
Then, I created an indicator for when the 1-month forward, 53 months from now turns from positive to negative. Only the first negative crossing is included so that each inversion episode enters the sample once. This does not remove the look-ahead bias created by selecting the spread on the same historical recession record.
Lastly, I calculated S&P 500 price returns with 180-, 365-, 730-, and 1,095-row shifts on the joined daily dataframe, using the next available market close when a shifted row did not contain one.
From 1990 through the article’s 24 March 2025 cutoff, the “perfect” spread inverted four times. The grey dotted line indicates a return of 0%, and the red line indicates the mean (or average) return of the 3-4 eligible data points for aggregation purposes.
S&P 500 6-Month Returns After 53m1m – 1m Spread Inversion (w/ MA)
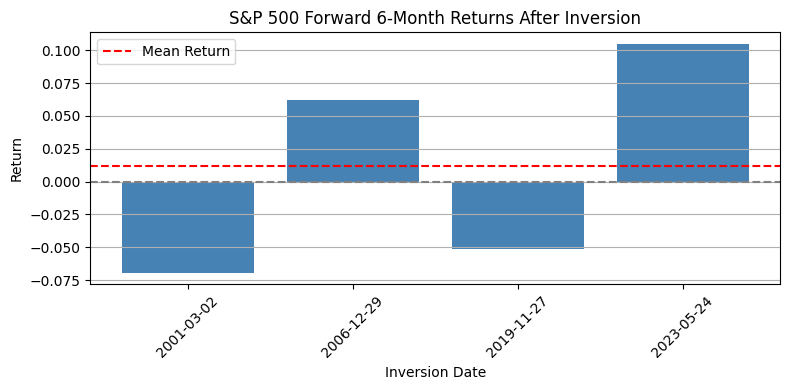
At the article’s 24 March 2025 cutoff, the 2001, 2006, and 2019 inversions were associated with the dot-com, GFC, and pandemic recession episodes, while the most recent inversion in 2023 had not been followed by a recession.
The 2001 inversion arrived after the dot-com decline had begun, while the 2019 inversion came shortly before the pandemic decline. The 2006 inversion preceded the GFC by more time.
S&P 500 1-Year Returns After 53m1m – 1m Spread Inversion (w/ MA)
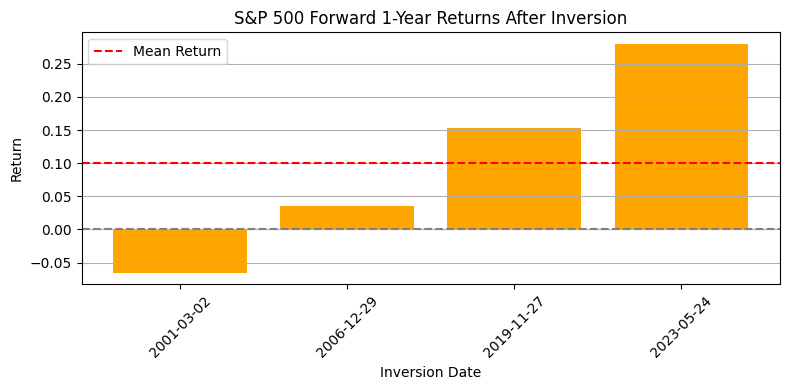
The 2001 inversion occurred after the dot-com decline had begun and was followed by a negative one-year return. After the 2019 inversion, the market had rebounded one year later following the pandemic decline.
Clearly, the returns following the inversion ahead of the GFC dropped from the 6-month period to the 1-year mark.
S&P 500 2-Year Returns After 53m1m – 1m Spread Inversion (w/ MA)
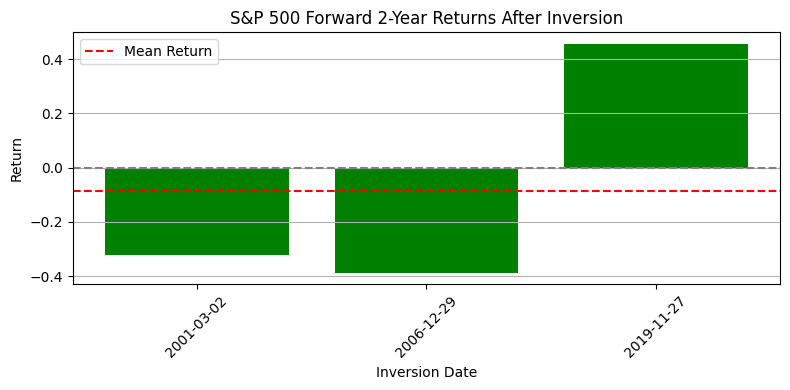
This chart excludes the 2023 inversion because two years of subsequent data were unavailable. The 2001 and 2006 inversions were followed by large negative two-year returns, while the 2019 inversion was followed by a large positive return.
S&P 500 3-Year Returns After 53m1m – 1m Spread Inversion (w/ MA)
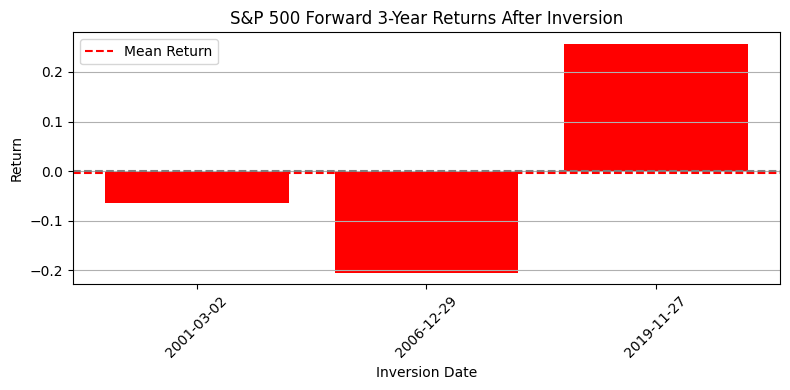
Lastly, this chart shows the 3-year future returns after the respective inversion. The market during dot-com crash and GFC had still not recovered even three years after the inversion.