

Reviewed and updated 20 July 2026
Hello!
This will be the start of a multi-part series on so-called recession “predictors” and their historical validity. Given the recent market volatility and correction, these indicators are more important than ever.
This series will also feature findings from an academic paper that claims to have found the “perfect” recession predictor by examining millions of permutations of interest rate spreads. This paper was also featured in my Recent Academic Research post a little while ago.
This first post will introduce common recession indicators and popular academic papers on recession prediction.
Let’s get into it.
Introduction
As I stated in the free subscriber preview above, this post will cover a few popular recession indicators and highlight a few academic papers on the subject. Now, I could spend 20+ posts covering all the different hailed “recession indicators” in depth, and while I may find that enjoyable, it may become boring to read.
Therefore, in this post, I’ll give a quick overview on some popular recession indicators and their historical predictive power. I’ll also highlight a few academic papers that I’ve come across.
The next post will likely cover the “perfect” recession predictor from a research paper that I had highlighted in the past. I want to do this as I am eager to dive into the indicator and I don’t want to keep you all waiting longer than you have to. However, I do think that it is important to set the stage a bit in order to show just how “perfect” the indicator from the paper is.
Also, I wanted to highlight an issue of statistical significance in this series. Fortunately for us, the U.S. does not have major economic crises very often. The U.S. has seen unprecedented economic growth and prosperity over the last 100 years. Unfortunately, this means that there are only a few recessions to “predict” with historical data. Keep this in mind when we cover the indicators. Just because one indicator perfectly predicted prior recessions and had no false positives does not mean that it will continue to stay perfect.
The changing economy of the U.S. may disrupt relationships from decades ago. I’ll also only cover U.S. recessions because economic structures differ across countries, and keeping the focus on one country makes the comparisons cleaner.
Lastly, if you all enjoy this post and want to see more, please let me know! I am happy to research any suggested recession indicators and potentially feature them in future posts in this series.
Common Recession Indicators
Today, I’ll cover the 10Y-2Y Spread, the 10Y-3M Spread, the Near Term Forward Spread (NTFS), and the Sahm Rule. There are plenty more that I want to cover (Oil above 100, Economic Policy Uncertainty, Corporate Bond Spreads), but I’ll save those for the academic paper section of this post and/or for future parts of the series.
10Y-2Y Spread
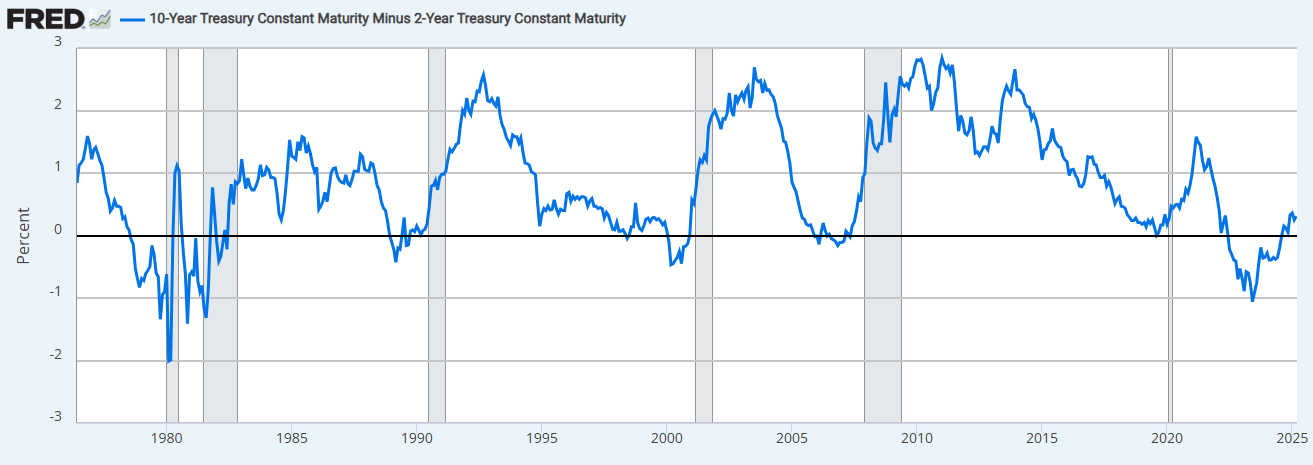
First and foremost, let’s look at the 10Y-2Y spread. This is the most common measure of yield curve inversion (to my knowledge). The 10Y-2Y spread is quite intuitive, as it shows the difference between the 10Y U.S. treasury yield and the 2Y U.S. treasury yield.
Clearly, all six recessions in this graph are preceded by a flattening and eventual inversion of the spread (and yes, the spread briefly inverted before the 2020 pandemic). However, the time between the start of the inversion and the start of a recession are quite far apart and vary between observations.
Interestingly, the spread normalizes from inversion right before the past four recessions. Today, the spread has recently normalized from its inversion as well, albeit at a slower rate than the prior four observations.
10Y-3M Spread
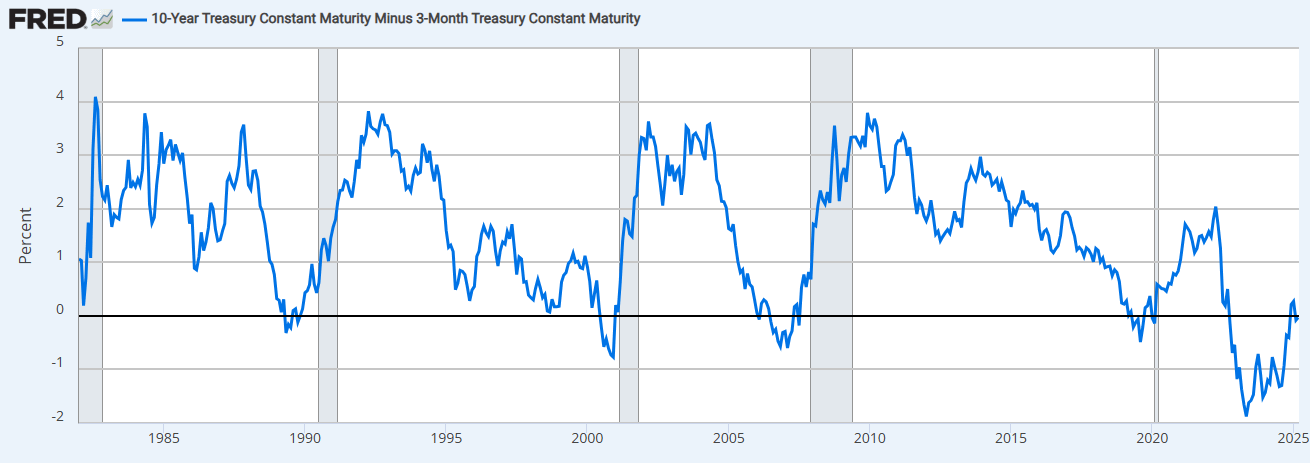
Similar to the 10Y-2Y spread, the 10Y-3M spread is calculated by subtracting the 3M yield from the 10Y yield. This FRED chart does not go back quite as far as the 10Y-2Y chart, but it displays similar characteristics, from the yield inversion and corresponding normalization before the four most recent recessions.
Additionally, the New York Fed creates an estimate of the probability of a U.S. Recession with the 10Y-3M spread. The updated graph (as of March 6, 2025) is shown below.
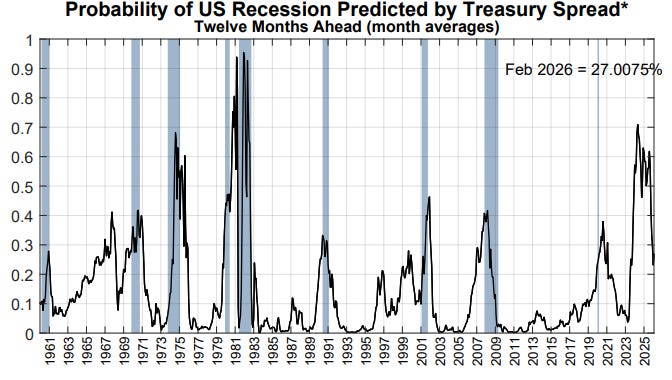
While the chart’s 27% model-estimated probability of a recession in February 2026 was nothing to shrug off, it was down from roughly 70% for target months in mid-2024. Those higher readings were not followed by an NBER recession in the corresponding forecast months; as of July 18, 2026, the NBER still dates April 2020 as the most recent trough. In other words, this episode is itself a false positive for a 50% threshold. This may still be something to keep an eye on.