

Hello and welcome back to another paid post!
Today, we are taking inspiration and guidance from a new paper by Goldstein, Li, and Wang. This explores the 2024 U.S. presidential election, where changes in Polymarket’s Trump probability predicted next-day returns on Trump-sensitive assets by roughly 13 basis points per percentage point of movement, with a simple long-short strategy earning a Sharpe of nearly 2. We tested it. The lead-lag is real, the placebo is clean, and the story it tells about prediction markets is more interesting than the trading signal it produces.
Let’s dive right in.
The Setup
Prediction markets are supposed to be information aggregators. People bet real money on future outcomes, and the resulting prices, in theory, distill dispersed information into a single number. That number is useful only to the extent that other people look at it and act on it. This paper asks a specific version of the question about whether people look at it. During the 2024 U.S. presidential election, did traders in traditional financial markets watch Polymarket, and did they trade on what they saw?
The authors examine daily changes in the Polymarket Trump-YES probability and test whether those changes predict next-day returns on a portfolio of assets that market commentary flagged as sensitive to Trump’s electoral prospects. Their answer is yes. A one percentage point increase in Trump’s implied probability was associated with about 13 basis points of next-day return on the Trump-trade basket, statistically significant and economically meaningful.
The identification challenge is the usual one. Both markets might be reacting to the same underlying news, with Polymarket happening to move first. To distinguish real cross-market learning from sequential news arrival, the authors exploit on-chain wallet-level data to classify individual Polymarket traders as informed or uninformed based on their post-trade profitability. They then show that price impact from uninformed trades also propagates to traditional markets before partially reversing. Since noise cannot reflect fundamental information, its transmission establishes that traders in equities and currencies are genuinely extracting signals from Polymarket prices, not just responding to the same news feed at a lag.
For our test we focus on the price-level analysis in the paper’s Section 3. Wallet-level classification requires pulling and processing the full universe of on-chain Polymarket transactions, which is a separate exercise. What follows uses public price data from the Polymarket CLOB API and daily returns from yfinance for the 34 signed Trump-trade assets.
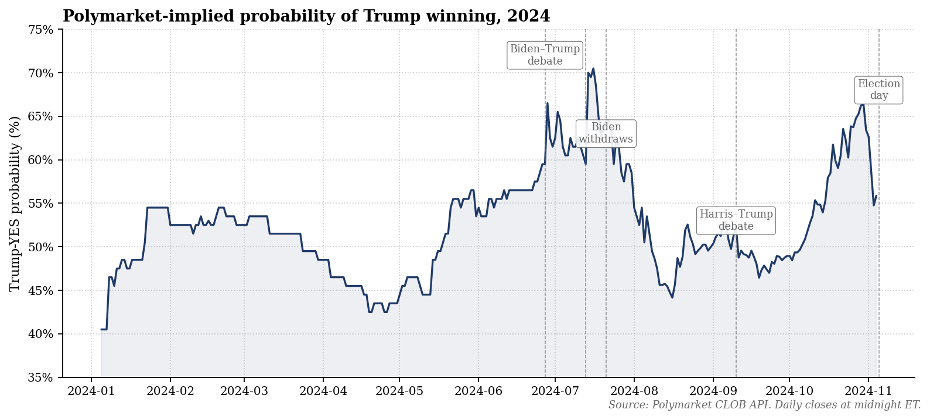
Figure 1. Polymarket-implied probability of a Trump win, January through November 2024. Key events annotated.
The Trump Trade Portfolio
The paper’s Trump-trade portfolio is not a factor model. It is a narrative-based classification. The authors reviewed contemporaneous financial media, primarily Bloomberg, the Wall Street Journal, and the Financial Times throughout 2024, and cataloged the assets that analysts and commentators repeatedly identified as exposed to Trump’s electoral prospects. The result is a portfolio of 34 assets across five categories: broad equity ETFs, bond ETFs, six large bank stocks, currencies and commodities, and a small “Connected” set consisting of Trump Media, Phunware, and Tesla.
Each asset gets a directional sign based on whether it would benefit or suffer from a Trump victory. Bank stocks and equity ETFs go long on the expectation of tax cuts and financial deregulation. Treasury bonds go short on the expectation of fiscal expansion and inflation. The dollar goes long against foreign currencies, reflecting tariff policy. Bitcoin, Ethereum, and gold go long. The three Connected names go long as direct campaign-linked equities.
Once we sign each asset’s return in the expected direction, the paper’s construction implies that if the market genuinely tracks Trump’s odds, all five categories should trend up together as those odds rise, and down together as they fall. This is exactly what we see in the data.
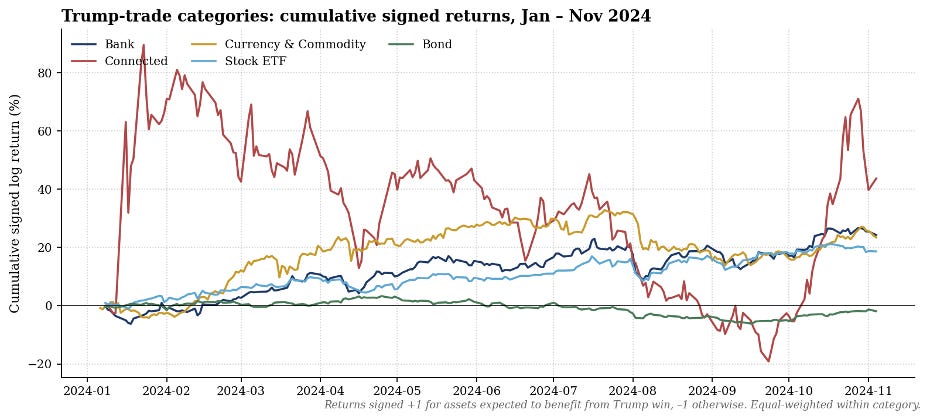
Figure 2. Cumulative signed returns by asset category. Each category is equal-weighted across its constituents.
The Connected category is extraordinary, mostly driven by DJT’s post-merger volatility, but the more instructive pattern is the broad co-movement of the other four categories through the second half of the year. Bank stocks, equities, and the dollar basket climb together as Trump’s implied probability rises from roughly 45 percent in April to over 60 percent by early July, then move sideways after the Biden withdrawal, then accelerate together into the election. Bonds are the mirror image, drifting slightly negative on the signed basis. This is a real portfolio-level exposure to a single political factor, and it makes the lead-lag test meaningful.