
The Mechanics of Skew and Vanna: Part 2
[WITH CODE] Why is the Volatility Surface Skewed, and Can We Use It to Predict Returns?

Reviewed and updated 20 July 2026
Hello!
Welcome back to the second post in this short series. Last post, we discussed the origin of skew in the option chain and what drives this skew. Additionally, we covered analysis on the informational value of skew for future equity returns.
Today, we will be covering the option Greek Vanna, which measures the interaction between spot and volatility, alongside some more academic papers. A research companion with runnable Vanna and risk-reversal examples is included below. Let’s get into it.
What is Vanna?
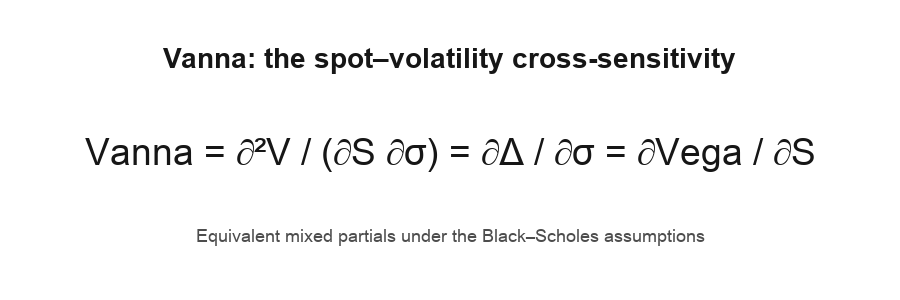
Vanna is a second-order option Greek that measures how delta changes when volatility changes, or equivalently how vega changes when spot changes. It can matter when spot and the volatility surface move together, but it is not itself a measure of skew. Here is the formal definition:
Vanna, also referred to as DvegaDspot and DdeltaDvol, is a second-order derivative of the option value, once to the underlying spot price and once to volatility. It is mathematically equivalent to DdeltaDvol, the sensitivity of the option delta with respect to change in volatility; or alternatively, the partial of vega with respect to the underlying instrument’s price.
To define this precisely, here is the mathematical relationship that shows Vanna and the equivalence between DvegaDspot and DdeltaDvol, which is due to the symmetry of second derivatives, which is also known as Schwarz’s Theorem.
Vanna can be visualized by holding strike and the other inputs fixed, plotting an option’s raw Black–Scholes vega as spot changes, and taking the slope of that curve, which gives DvegaDspot. The chart shows vega per one volatility point, so 100 times its displayed slope is Vanna.
Graph of Vega by Spot for 150 Strike Call
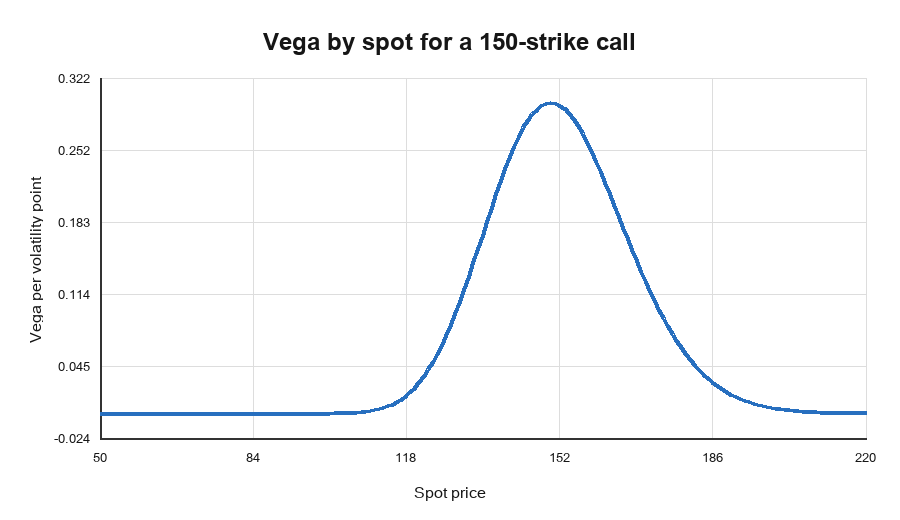
In this illustration, vega is highest near the at-the-money region. For the 150-strike call, vega per one volatility point is approximately 0.056 at spot 125, 0.298 at spot 150, and 0.0047 at spot 200.
In this illustration, vega rises as spot approaches the option’s highest-vega region and falls after it passes that region, so Vanna changes sign nearby. The exact zero-Vanna point depends on rates, dividend yield, volatility, and time to expiry; it need not be exactly at the strike.
This exact relationship is shown below.
Graph of Vanna by Spot for 100 Strike Call
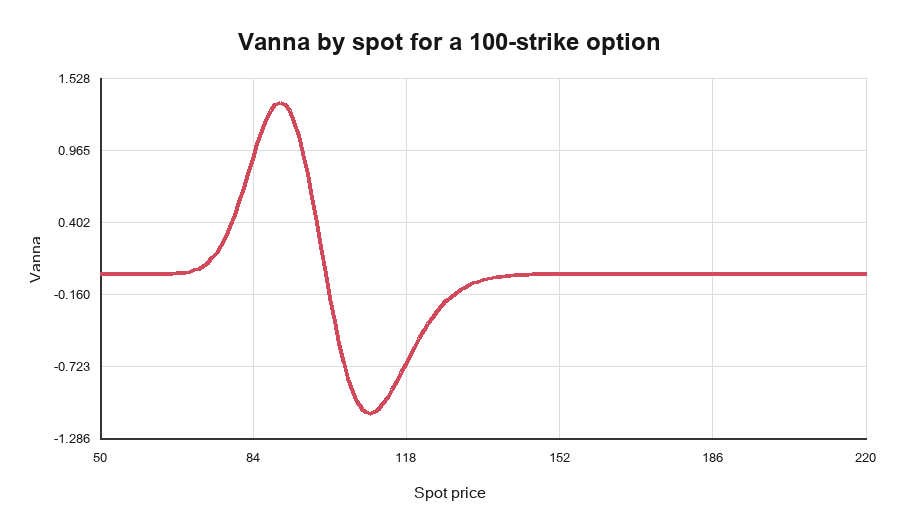
This vanna graph is applicable to long calls and long puts. It is flipped for short calls and puts.
In the illustrated OTM-put setup, this can fuel losses for market makers who sold put options to institutions for downside protection. The short put is long delta, short gamma, short vega, and can have positive (long) Vanna in that region.
If volatility rises while the option remains in that region, positive Vanna makes the short put’s delta more positive. A dealer who is hedging delta may then need to sell more of the underlying; the exact response depends on the joint spot-volatility move and the rest of the book.
Risk Reversals
Now that we know what skew is, and that Vanna measures a local spot-volatility sensitivity, how can an options position express a view on the shape of the volatility surface?
One option structure used to trade skew is the delta-hedged risk reversal (RR). A collar combines a risk reversal with a position in the underlying. There is some nuance depending on the market: equities traditionally have negative skew, while some currency pairs and commodities can have positive skew. Risk-reversal quoting conventions also vary, so the legs are stated explicitly below.
However, the structure is still the same, and today we will (mostly) be focusing on equities, as I am sure that is what most of you are most familiar with.
Long Risk Reversal (RR) = Long OTM Call & Short OTM Put
Short Risk Reversal (RR) = Short OTM Call & Long OTM Put
In both examples, the OTM call and put are matched by absolute delta; their signed deltas point in opposite directions.
I like to understand the risk reversal in an intuitive and mathematical way. In the intuitive way, you can think of skew like a lever. In equities, skew is typically negative (OTM put IV > OTM call IV), so the lever would look something like this:
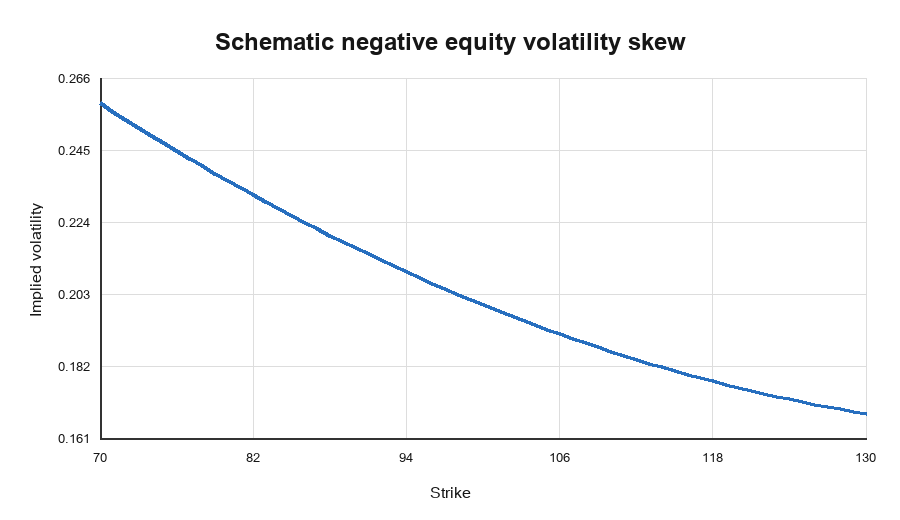
Now, if you are long skew, you would buy the OTM put and short the OTM call (short RR), hoping that the difference in volatility increases between two options matched by absolute delta. Therefore, you are also pushing on this lever, hoping that this lever becomes steeper.
And if you are short skew (short OTM put, long OTM call) with a delta-hedged RR, then you would be betting that the difference in volatility between your options falls (pushing down on the left side of the lever).
A risk reversal position will have the same skew position (long or short) for a wide range around spot (but it will eventually flip if spot moves very far away from your strikes).
This is because of the Vega profile of the RR. Below, I show the Vega profile of a short RR (long 90-strike OTM put, short 113-strike OTM call).
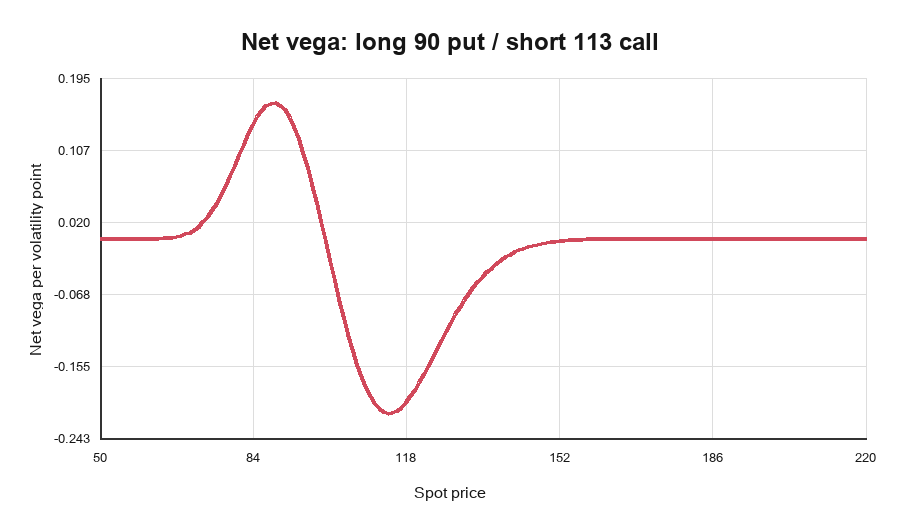
As spot moves higher, the position is initially long Vanna in the lower-spot region. The first transition lies near—but not necessarily exactly at—the long put strike.
Through the middle region, including the initial spot of 100 in this illustration, the position is short Vanna and long equity skew under the convention used here.
At higher spot levels, it returns to long Vanna. The second transition lies near—but not necessarily exactly at—the short call strike; both boundaries move with the model inputs.
Hopefully, you have learned something. But, is there actual information power in the skew of various securities and assets? Spoiler, the answer is yes, but I’ll explain more below.
Keep reading with a 7-day free trial
Subscribe to Alpha in Academia to keep reading this post and get 7 days of free access to the full post archives.