

Reviewed and updated 20 July 2026
Hello!
This is part 3 of the recent series that explores seasonality in the Treasury markets. In the past two posts, we explored intra-year and intra-month seasonality. We also showcased trading strategies that produced Sharpe ratios of 1.3.
Today, I will showcase intra-week seasonality and provide the code for a Monday short-duration rule. The selected 2022–2025 test reaches an active Sharpe ratio of 2.17 for the 30Y, but that result is sample-dependent and shown before real implementation costs.
Let’s get into it.
Introduction
Recap from last week:
What we studied: Treasury seasonality through the clean lens of basis-point changes in yield (not %-changes of a %). We used 1977–present data for the 2Y/5Y/10Y/30Y Treasury securities.
Monthly patterns: On average, summer richening (yields down, prices up). February and November showed the largest average moves, but outliers pulled the mean from the median. The 30-year November move was the only raw month-by-maturity result below 5%; none of the 48 comparisons remained significant after the multiple-testing adjustment.
Day-of-month detail: Days 29–31 showed the largest average yield declines across the curve, with day 31 the strongest. After the 124-test adjustment, the day-31 result remained below 5% for the 5Y, 10Y, and 30Y, while the 2Y result was below 10%. The analysis also showed a smaller run-up around day 21, most clearly supported in the 2Y and 5Y. To avoid month-length quirks, I framed trades by trading day from month-end rather than calendar date.
Anchor paper (Hartley & Schwarz, 2019): Excess returns on coupon Treasuries are positive and highly significant only in the last few trading days of the month. Implementation: buy t days before month-end, finance at GC repo, sell on the last trading day; evaluate excess return = bond return – rolled GC. Average returns peak over 3–5 days, while Sharpe peaks around 2–3 days. The pattern shows up in on-the-run cash, futures, and swaps, and lines up with month-end insurer/index flows.
Backtest highlights: A simple “long last 2–3 trading days” rule produced meaningful total PnL and solid Sharpe over the full sample (up to ~0.7). In 2010–2025 the effect strengthened, as the 5Y reached a Sharpe > 1.3 with shallow drawdowns. Adding the 3rd day boosted PnL but slightly diluted Sharpe and increased drawdowns, consistent with flows peaking very late in the month.
Caveats & next steps: Headline results were shown before costs; sizing in DV01 terms keeps comparisons clean. Convexity is ignored.
As always, this is for educational purposes only and not financial advice.
Day of the Week Analysis
Once again, we are going to start with some quick analysis. In order to determine if there is a pattern that we can take advantage of in a strategy, I computed the average daily close-to-close changes in yield (basis points) for 2Y, 5Y, 10Y, and 30Y Treasury securities. The period for this computation is from 1977 to 2025.
The table below also includes stars that showcase statistical significance. If there are no stars, then the average change in yields is not statistically significant. The notation is described below:
p < 0.01: ***
p < 0.05: **
p < 0.10: *
Mean bp change by weekday (with significance stars)
| Weekday   | 2Y        | 5Y        | 10Y       | 30Y       |
|:----------|:----------|:----------|:----------|:----------|
| Mon       | 0.645 *** | 0.651 *** | 0.571 *** | 0.436 *** |
| Tue       | -0.304 ** | -0.331 ** | -0.302 ** | -0.237 *  |
| Wed       | -0.102    | -0.032    | 0.01      | 0.091     |
| Thu       | -0.072    | -0.095    | -0.075    | -0.045    |
| Fri       | -0.203    | -0.255    | -0.279 *  | -0.321 ** |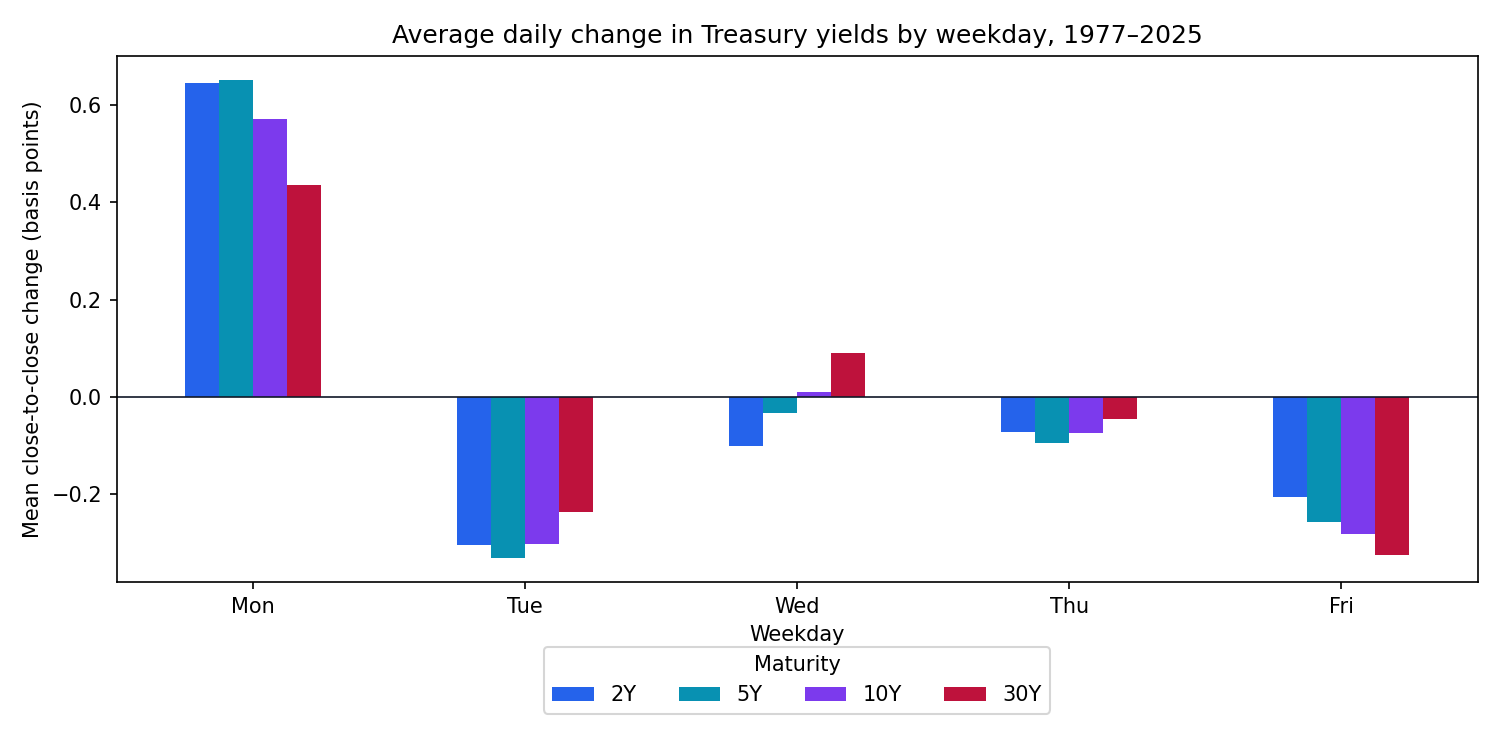
Monday shows a clear and consistent selloff in Treasuries in this sample. The average move is positive across every maturity, roughly 0.44 to 0.65 basis points, which means yields rise and prices fall to start the week. The stars in the table come from unadjusted classical tests.
Tuesday leans the other way, with negative average yield changes across all four maturities. The raw p-values are below 5% for 2Y, 5Y, and 10Y, but none of the Tuesday results is below 5% after the displayed 20-test Benjamini–Hochberg adjustment. Wednesday and Thursday sit close to zero. Friday also shows modest average declines; only the 30Y raw p-value is below 5%, and its Benjamini–Hochberg-adjusted value is below 10% rather than 5%.
Using classical two-sided one-sample t-tests, the Monday yield increases remain below 5% across all four maturities after Benjamini–Hochberg adjustment of the 20 weekday-by-maturity tests. Under Bonferroni, 2Y, 5Y, and 10Y remain below 5%, while 30Y is below 10% rather than 5%. These p-values were not tested for robustness to serial dependence or heteroskedasticity.
If you are looking at the chart, remember that bars above zero indicate yields going up and prices going down, and the stars flag results that are unlikely to be random. Taken together, the broad adjusted-test pattern in this sample is the rise in yields on Monday; the strategy below examines that Monday pattern only.