

Welcome back to another issue of Recent Academic Research!
Let’s get into it.
Rank-and-File Workers Are Hidden Drivers of Reporting Quality
Corporate reporting quality depends less on executives and more on the rank-and-file workers who produce, verify, and respond to it.
This review reframes accounting research by tracing how non-executive employees shape, and are shaped by, corporate disclosure across a four-stage Labor Life Cycle (education, job search, employment, and turnover). The authors synthesize over 130 studies showing that workforce quality is a first-order driver of reporting outcomes. Firms paying above-market wages to accountants and auditors produce fewer restatements and stronger internal controls, consistent with efficiency wage theory. Stricter CPA licensing (the 150-hour rule) shrinks the talent pipeline, especially among minority candidates, without measurably improving quality, pointing to supply restriction rather than skill-building. On the user side, earnings announcements trigger job searches by incumbent employees, pay ratio disclosures shift satisfaction and turnover, and Glassdoor reviews predict stock returns.
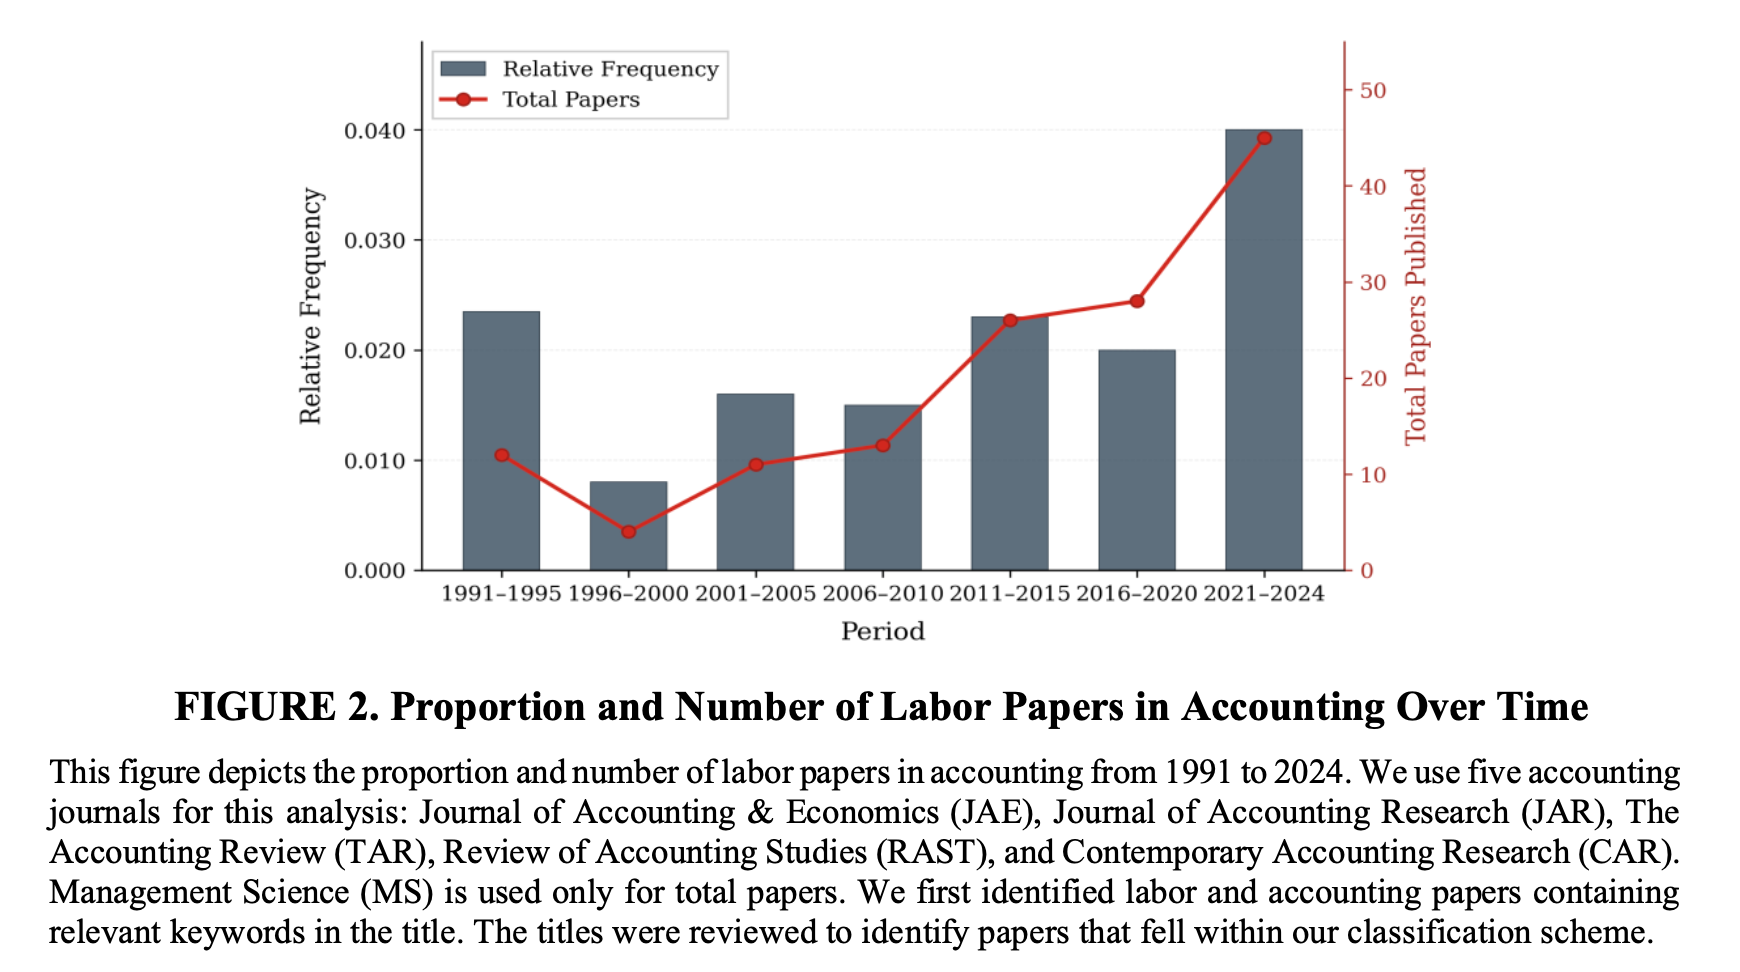
For investors, the takeaway is that human capital metrics (turnover rates, staffing levels, pay dispersion) carry signal about future reporting reliability and firm performance, yet remain poorly standardized in current disclosures.
Barrios, John Manuel and Choi, Jung Ho and Deller, Carolyn and Pacelli, Joseph and Packard, Heidi A., Labor and the Corporate Information Environment: A Review. (June 18, 2026). Harvard Business School Working Paper No. 26-060, Harvard Business School Accounting & Management Unit Working Paper No. 26-060, The Wharton School Research Paper , HKU Jockey Club Enterprise Sustainability Global Research Institute Paper No. 2026/037, Available at SSRN: https://ssrn.com/abstract=6390718 or http://dx.doi.org/10.2139/ssrn.6390718
A Faster Way to Price American Commodity Options
An explicit finite difference method called ADE prices American commodity options under the Schwartz two-factor model hundreds of times faster than Least Squares Monte Carlo at matched accuracy.
Pricing American options on commodities is harder than on stocks because you need a second state variable (the convenience yield, the implicit benefit of holding the physical commodity) and because the holder can exercise any day. The standard workhorse, Longstaff-Schwartz Monte Carlo, handles this but is slow. The author implements the Alternating Direction Explicit (ADE) scheme, which keeps the simplicity of an explicit method while remaining stable, on the Schwartz two-factor PDE for WTI crude. Validated against the closed-form European price and benchmarked against LSMC with 250,000 paths, the ADE solver matches the Monte Carlo price to within 0.03% on a six-month at-the-money put, and reaches a given accuracy roughly 200 to 400 times faster.
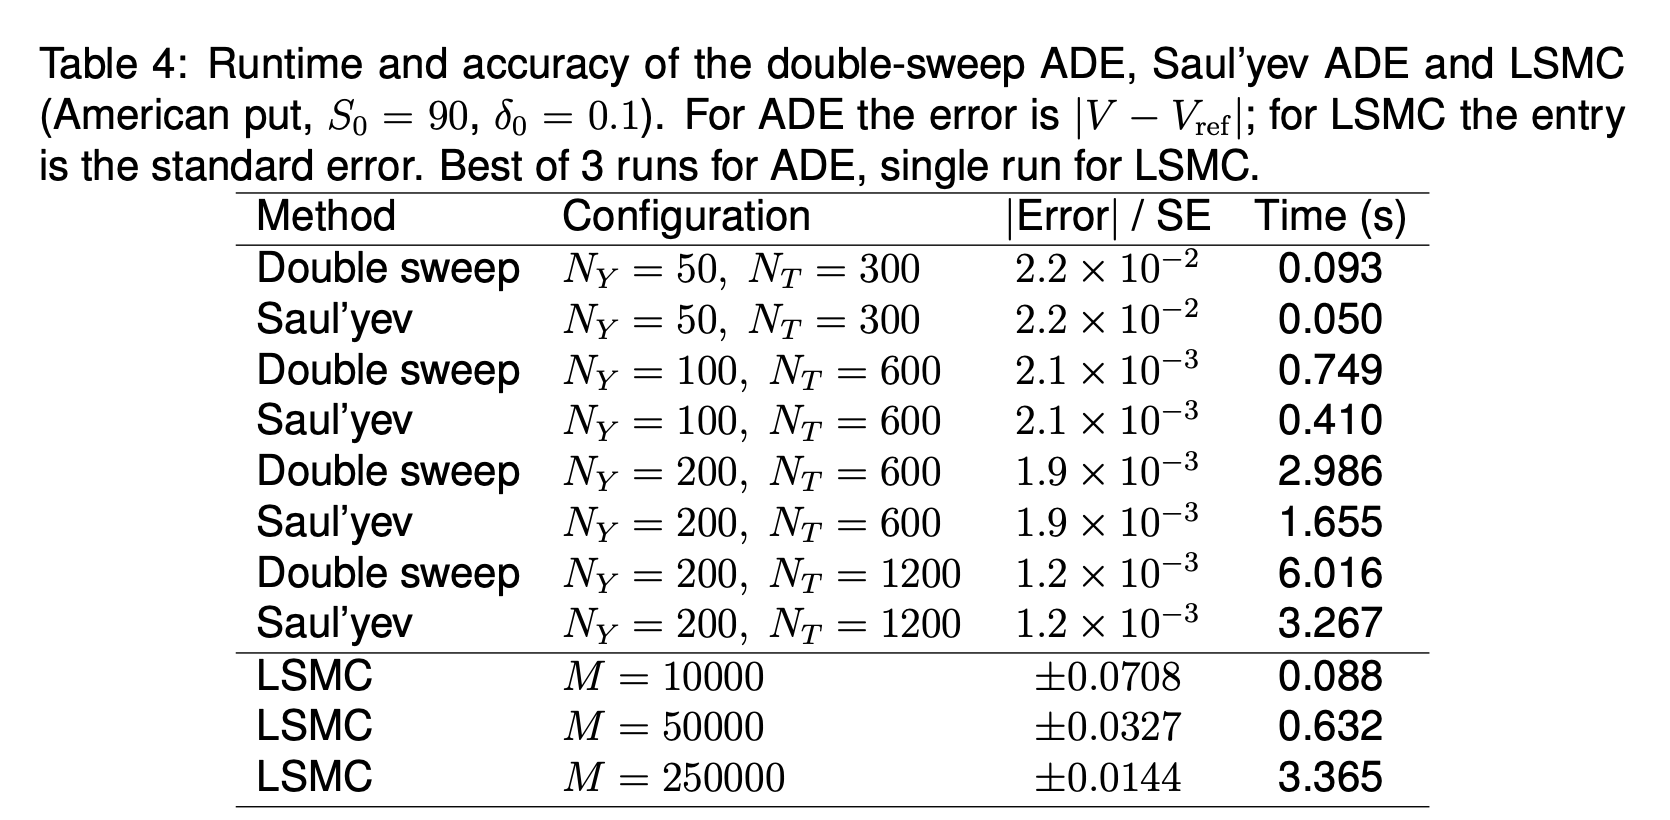
Extensions include exercising on a futures price (how listed ag options actually trade), seasonal parameters, and two-factor Greeks that produce a hedge in two futures maturities. For anyone pricing or risk-managing commodity options, the practical read is that PDE methods are not obsolete, they can be meaningfully cheaper than simulation when the dimensionality stays small.
Prabhu, Sanjith and Duffy, Daniel, Pricing American Commodity Options Under the Schwartz Two-Factor Model Using the Alternating Direction Explicit (ADE) Method (October 10, 2026). Available at SSRN: https://ssrn.com/abstract=7604358 or http://dx.doi.org/10.2139/ssrn.7604358
Bond Indices Quietly Tax Their Own Trackers Every Month-End
Government bond futures earn roughly seventeen times their normal daily return on the last trading day of the month, driven entirely by mechanical index rebalancing.
Fixed-income indices rebalance at month-end, and because bonds age while new issuance tends to come at longer maturities, the index duration systematically extends by about 0.08 years each month. Benchmark-tracking funds (ETFs, pensions, insurers) must buy that duration near the index pricing snapshot to avoid tracking error, and this synchronized, price-insensitive demand pushes prices up. The authors find duration-scaled futures returns average 1.19 basis points on month-end days versus 0.07 on other days, with a single day accounting for 47% of average monthly returns. The effect peaks right before the Bloomberg snapshot and partially reverses after, a textbook signature of non-informational price pressure.
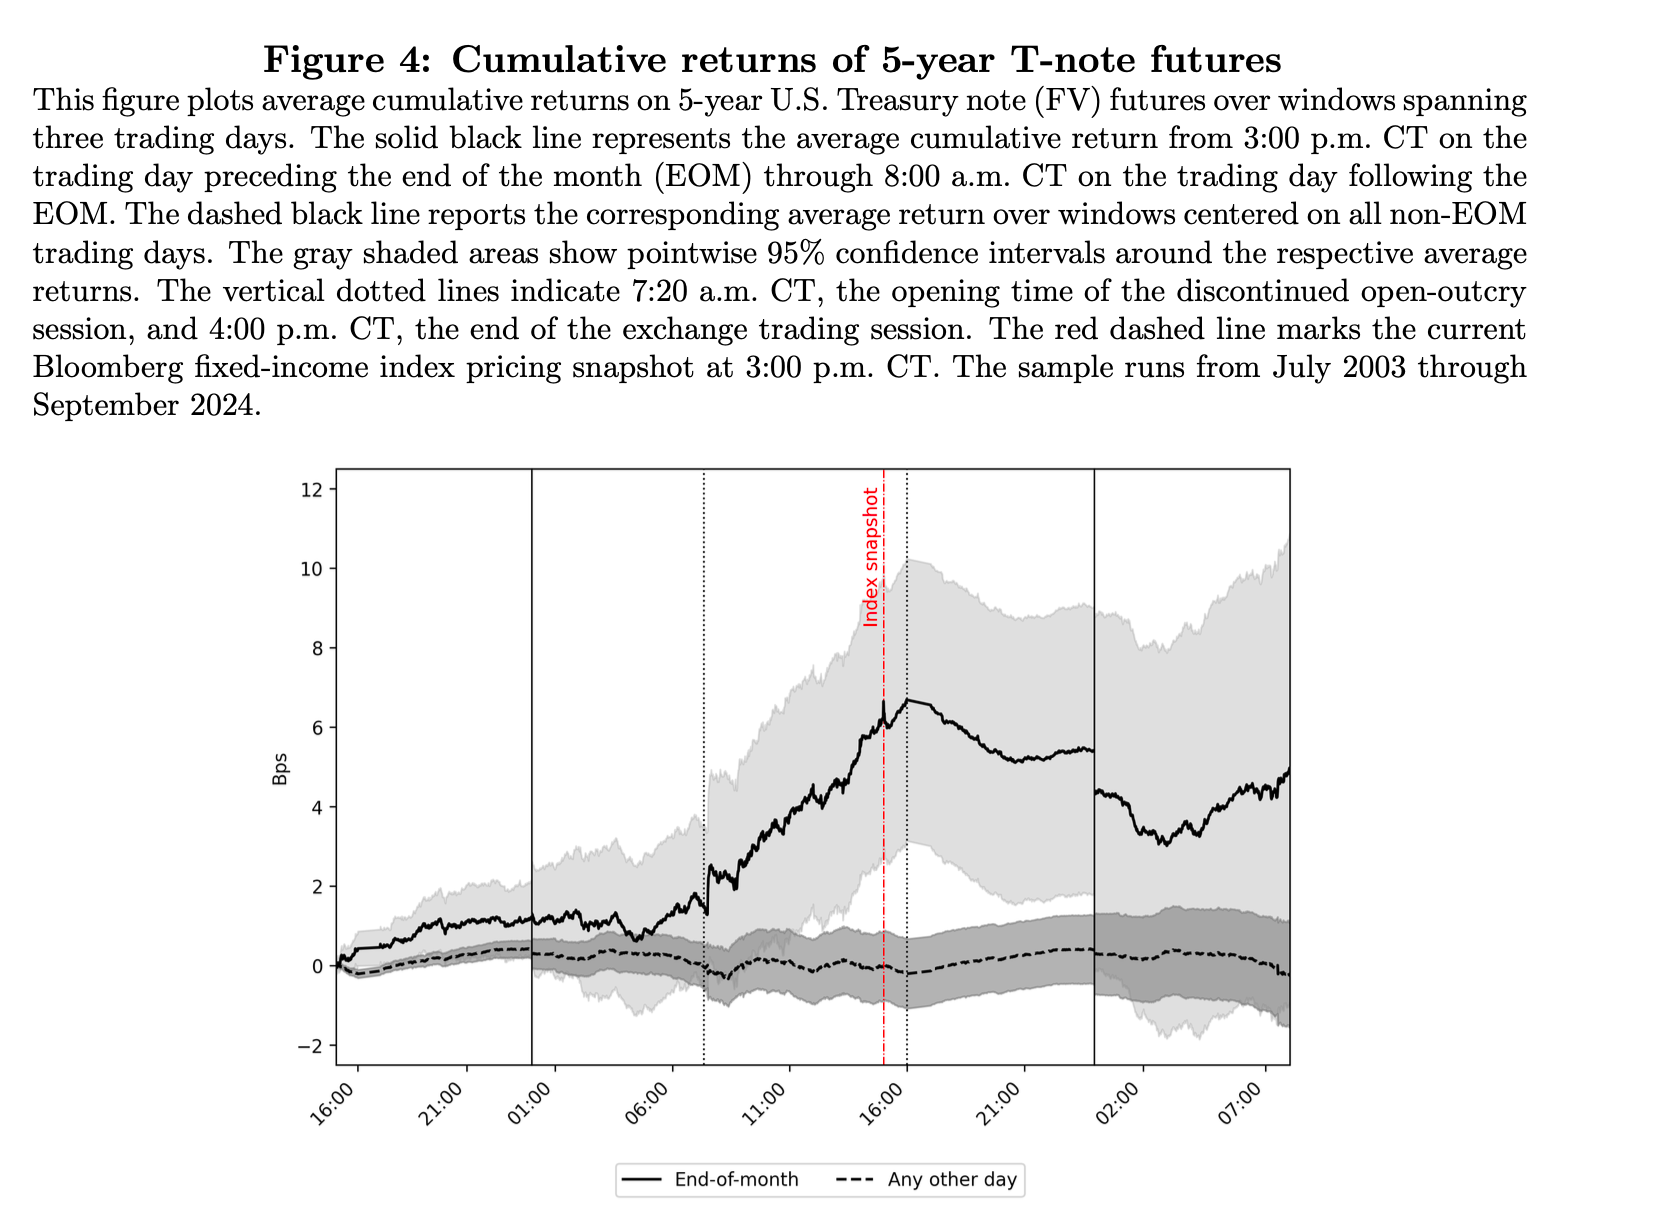
When Bloomberg shifted its US snapshot time by one hour in 2021, trading volume and returns migrated with it, while Germany showed no shift. For benchmark-constrained managers this is a recurring hidden cost; for anyone willing to supply liquidity into the snapshot, it is a predictable, non-risk-based source of return.
Soebhag, Amar and Verwijmeren, Patrick and Martinetti, Fabio, Buying Duration: Index Rebalancing and Price Pressure in Government Bond Markets (October 12, 2026). Available at SSRN: https://ssrn.com/abstract=7601879 or http://dx.doi.org/10.2139/ssrn.7601879
Gold Still Beats Silver When You Score Them Side by Side
Across a battery of financial tests from 1990 to 2024, gold beats silver as the better investment, mainly because silver is far more volatile for only a modest return premium.
The author runs both metals through five tests (macro integration, predictability, loss rate, volatility, and returns across short, medium, and long horizons) and scores them with a Pugh decision matrix. Gold shows strong long-run integration with the US stock market (NASDAQ, S&P 500, Dow Jones) and oil, qualifying it as a genuine safe haven, while silver only tracks oil meaningfully. Both metals post losses in roughly 45% of months, but silver’s drawdowns are deeper, with return variance running about three times gold’s.
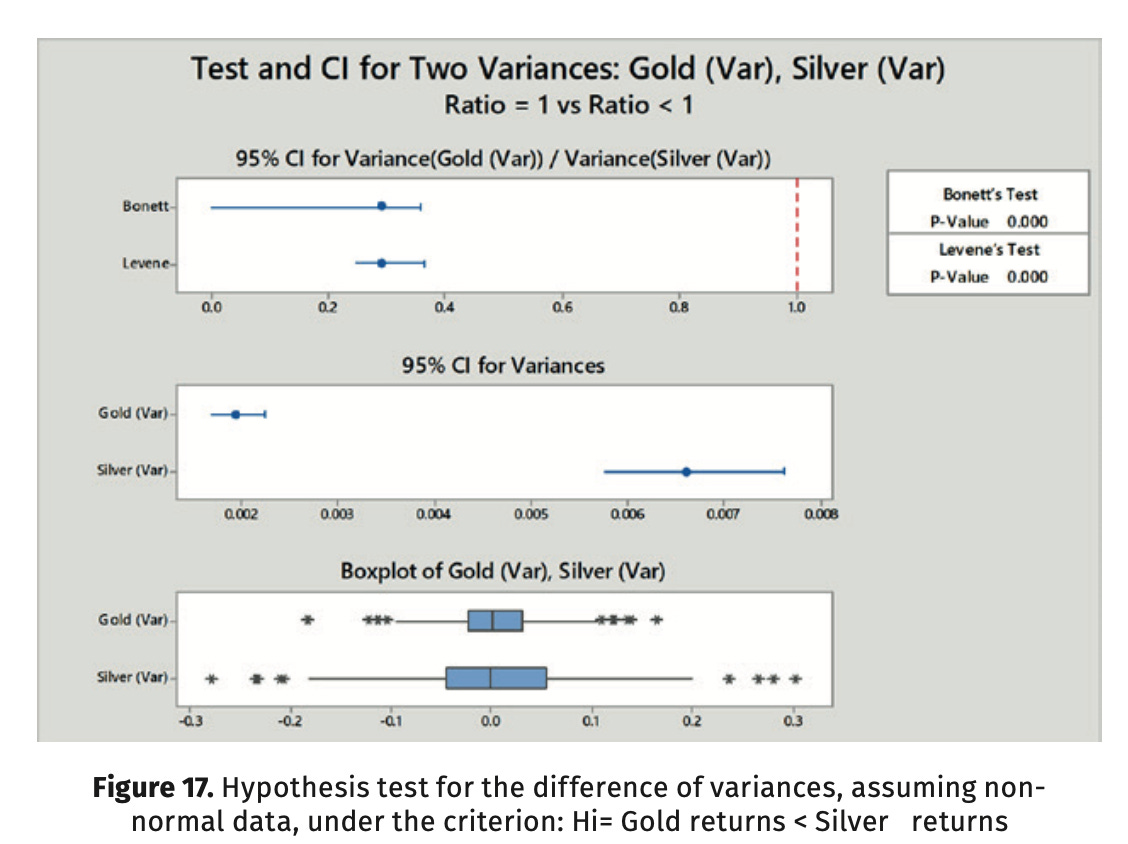
Silver does edge gold on medium and long-term annualized returns (12.2% and 8.7% versus 10.5% and 6.2%), but gold wins the short term and carries far less risk. The practical read for investors: gold works as the defensive long position when markets wobble, while silver behaves more like a speculative, higher-beta cousin whose extra return rarely compensates for the ride.
Vacio-Hernández, Iván Alejandro, Gold or Silver: An Alternative to Investing (March 12, 2025). Apuntes del Cenes, volume 44, issue 79, 2025[10.19053/uptc.01203053.v44.n79.2025.17833], Available at SSRN: https://ssrn.com/abstract=7620858
Volatility Scaling Tames Momentum Crashes, But Not Everywhere Anymore
Volatility-managed momentum dramatically cuts crash risk in developed markets, but the edge has quietly faded in emerging markets since 2010.
The authors revisit the classic Daniel-Moskowitz momentum crash story using international Fama-French factor data through April 2026. The pattern still shows up, past losers rebound violently after prolonged market weakness, crushing the short leg of a winners-minus-losers portfolio, but it is sharpest in developed markets and in the pre-2008 sample. Applying a strictly ex-ante volatility scaling rule (position size inversely proportional to recent realized variance) lifts the developed-market Sharpe ratio from 0.53 to 0.87 and shrinks the worst drawdown from -43.6% to -10.7%. Emerging markets see a full-sample Sharpe lift from 0.98 to 1.29.
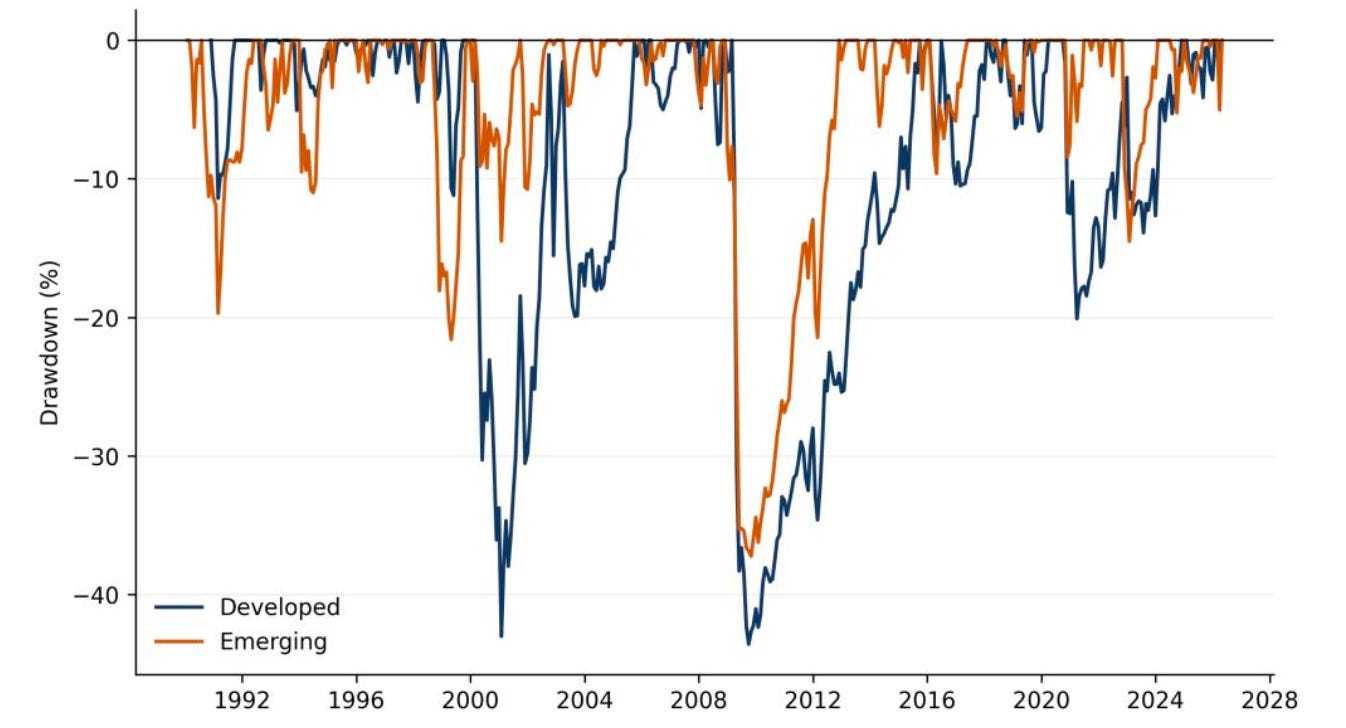
Figure 2. Drawdowns of static developed and emerging momentum portfolios.
The important caveat: after 2010, static emerging momentum actually posts a higher Sharpe (1.36) than the managed version (1.29), suggesting the overlay works best as drawdown insurance rather than a return booster. For practitioners, the takeaway is to treat volatility scaling as risk governance, instead of a universal alpha engine, and to recalibrate as market structure evolves.
Feng, Xuan and Huang, Linghan and Su, Yu, Revisiting Momentum Crashes: Volatility Timing across Developed and Emerging Markets (July 01, 2026). Forthcoming in Applied Economics, Available at SSRN: https://ssrn.com/abstract=7612298 or http://dx.doi.org/10.2139/ssrn.7612298
This week for paid subscribers
Paid subscribers are getting a full deep dive of the corporate bond credit return anomaly, reproduced on its original historical window and extended through September 2026 on the authors’ exact specification, against survival thresholds fixed before out-of-sample tests were observed. The post traces how the classic first-five-days return concentration in high yield ran hot into the end of the paper sample and turned into a post-paper point estimate of zero, and tests whether duration approximation noise, regime shifts, or a structural break is actually behind it. Python notebook and data included.

Disclaimer: The content provided in this newsletter, “Alpha in Academia,” is for informational and educational purposes only. It should not be construed as financial advice, investment recommendations, or an offer or solicitation to buy or sell any securities or financial instruments. Past performance is not indicative of future results. The financial markets involve risks, and readers should conduct their own research and consult with qualified financial advisors before making any investment decisions.
The interpretations, opinions, and analyses presented herein are those of the author and do not necessarily reflect the views of the original researchers, their institutions, or the full implications of the cited academic papers. While every effort is made to accurately represent the research discussed, readers should be aware that the summaries and interpretations may not capture the full scope or nuances of the original studies. The information contained in this newsletter is believed to be accurate and reliable at the time of publication, but accuracy and completeness cannot be guaranteed. The author and publisher accept no liability for any loss or damage resulting from reliance on the information provided.
This newsletter may contain links to external websites or resources. The author is not responsible for the content, accuracy, or reliability of these external sources.
By subscribing to or reading this newsletter, you acknowledge that you have read and understood this disclaimer and agree to hold the author and publisher harmless from any liability that may arise from your use of the information contained herein.