

Welcome back to another issue of Recent Academic Research!
Let’s get into it.
Fifteen Minutes Before the Close
The 4:00 PM close, the timestamp the entire derivatives industry marks its books against, has quietly become the worst fifteen minutes of the day to measure volatility.
Two identical measurements, fifteen minutes apart. The researchers built the same at-the-money, shortest-maturity implied volatility measure twice a day, once at 3:45 and once at the bell, using identical filters. The 3:45 version produces a usable number on 99.8% of trading days. The closing version works on 36.5%.
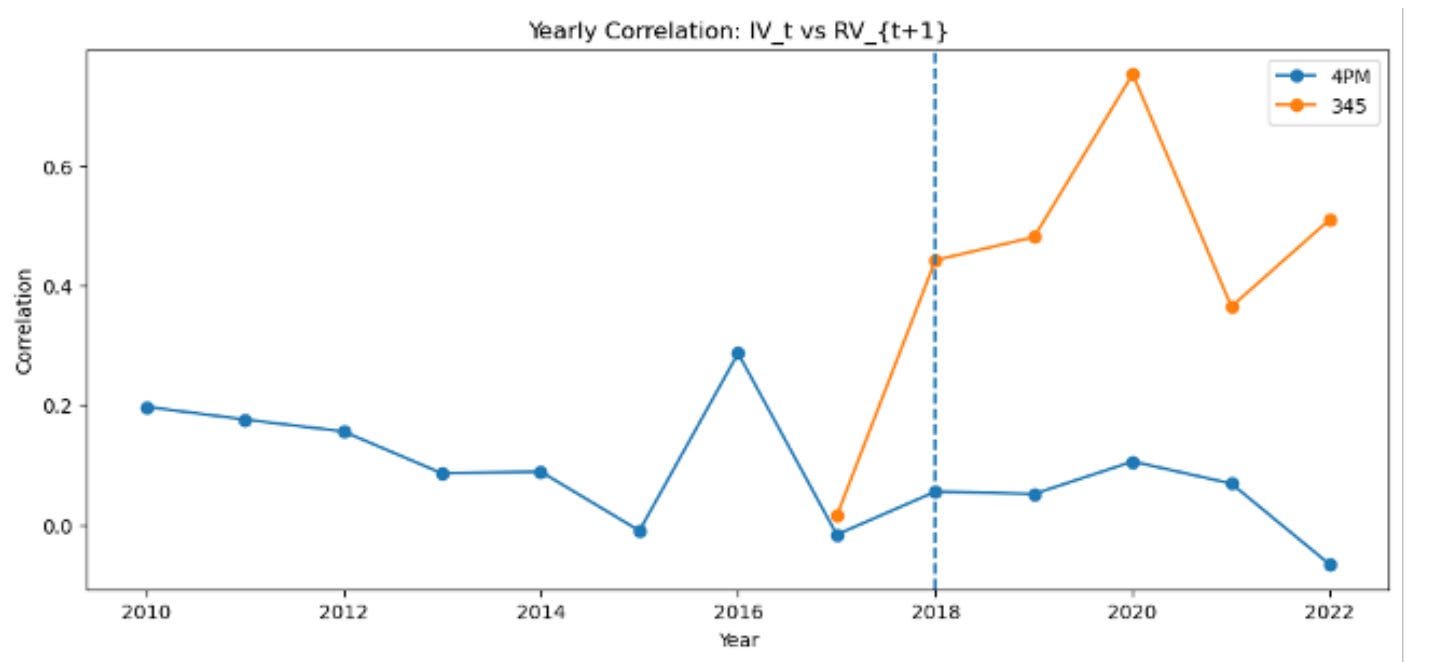
Figure 1: Correlation between each implied volatility signal and the next day's realized variance, by year. Same options, same selection rules, fifteen minutes apart.
Blame 0DTE options, which now account for much of the near-the-money volume and carry essentially zero remaining time value by market close, leaving the conversion from option price to implied volatility unstable or outright impossible. A wide gap in usefulness follows. Next-day realized volatility barely responds to the raw closing series, while the 3:45 series moves with it. On days when the close does return a real figure, that figure predicts perfectly well, which points to a broken thermometer rather than a market with nothing to say. Running the whole surface through a convolutional network adds accuracy, though a plain EGARCH stays annoyingly hard to beat. In the authors' words, “a later timestamp is not necessarily a better volatility signal.” Risk systems and valuation models fed by closing marks absorb that noise daily.
Clark, Brian J. and Palepu, Sai and Potì, Valerio and Siddique, Akhtar R., Last Fifteen Minutes: Equity Options Volatility at the Close (August 13, 2026). Available at SSRN: https://ssrn.com/abstract=7279624 or http://dx.doi.org/10.2139/ssrn.7279624
Borrowed Elasticity
Hedge funds hardly react to what it costs them to borrow a bond, because the size of the position was settled somewhere else entirely.
Insurers and pension funds routinely want more government bonds than actually exists. The gap gets filled by hedge funds, who sell the bond short and borrow it in the repo market so they can deliver it. Working from regulatory data on every repo backed by German government debt, the authors show that these borrowers barely respond to the price of borrowing. Push the borrowing cost up 10% and their borrowing falls roughly 1%.
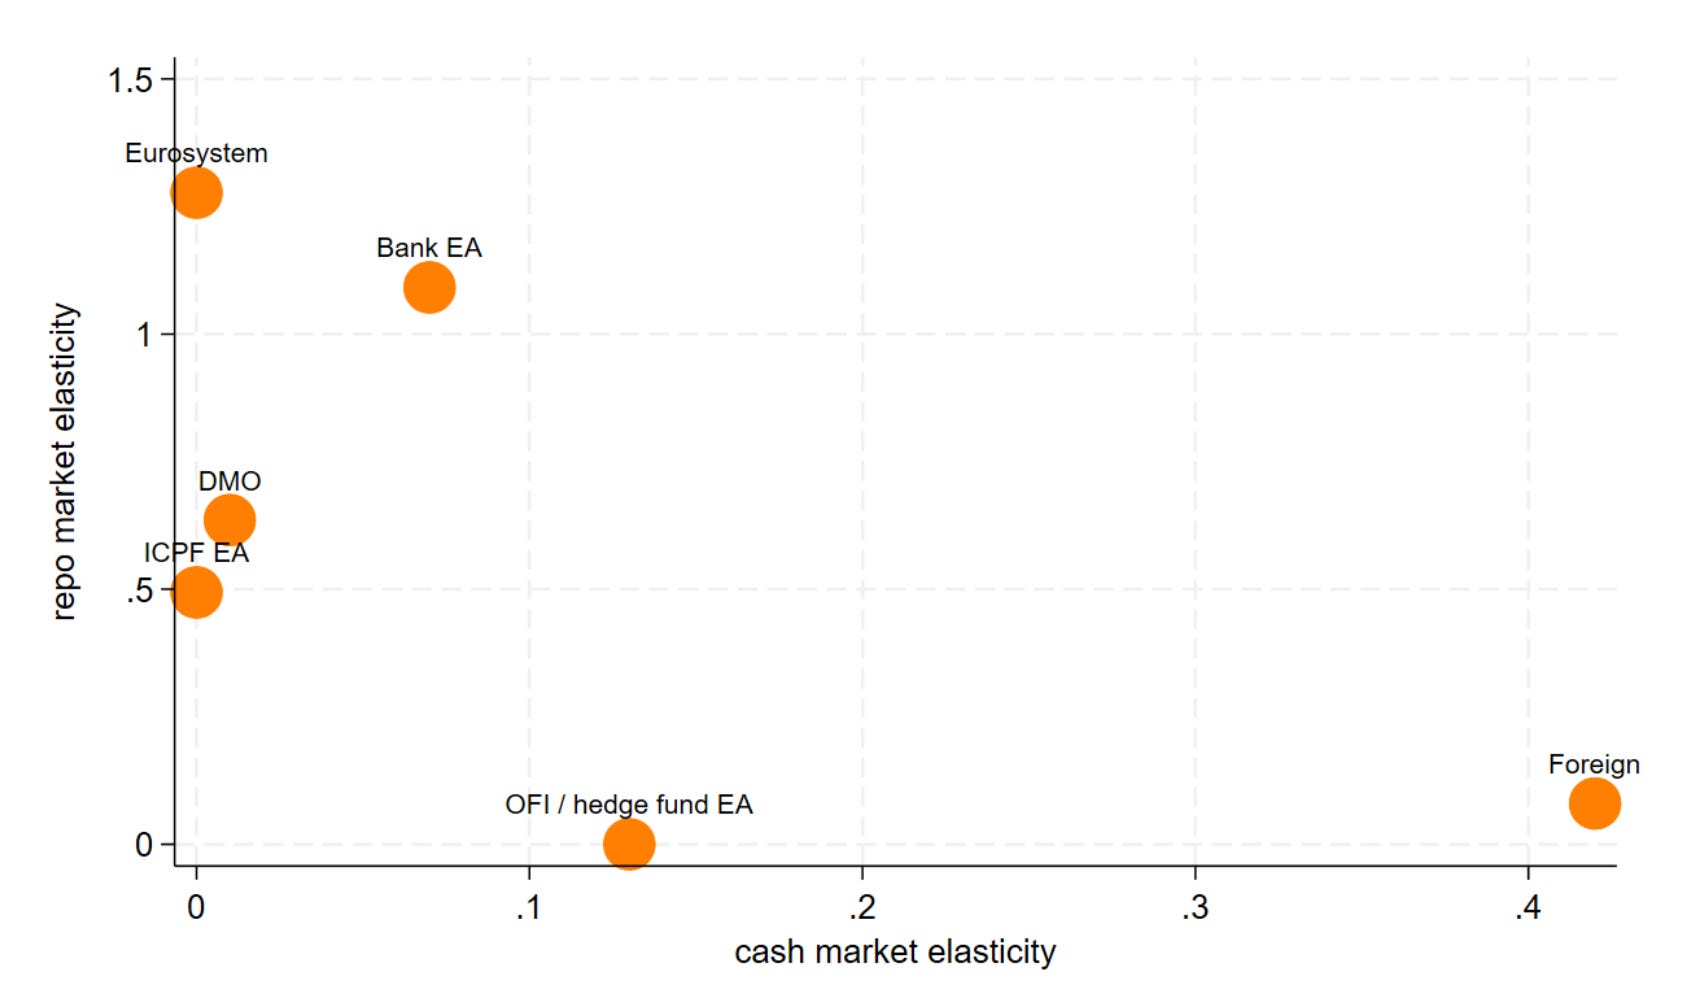
Figure 2: Same investors, opposite behavior. Each dot is one type of institution, plotted by how much its bond buying responds to price against how much its bond borrowing responds to price. Hedge funds, the bulk of the “foreign” dot, sit in the bottom right corner.
Strange, given that the same funds are among the twitchiest buyers in the cash bond market. What explains it is that the repo leg was never a decision in the first place. It is machinery supporting a short whose size somebody else's appetite for the physical bond had already determined. The adjusting happens on the lending side instead, largely at the German debt office and the ECB. Investors can take two things from this. Repo specialness (what you pay to borrow one particular bond) doubles as a real time pressure gauge on the cash market, and whoever sets the marginal price in Europe's safe asset funding market is sitting offshore, well past the reach of any European supervisor.
Poinelli, Andrea and Pelizzon, Loriana and Tomio, Davide and Nguyen, Benoît and Linzert, Tobias, Elastic in Cash, Inelastic in Repo: Hedge Funds in the Treasury and Repo Markets (August 07, 2026). SAFE Working Paper No. 492, Available at SSRN: https://ssrn.com/abstract=7258361 or http://dx.doi.org/10.2139/ssrn.7258361
Funding-Technology Feedback in the AI Buildout
The AI financing loop is close to the point where a shock stops fading and starts feeding itself, and the weak link is the leveraged miners, not NVIDIA.
Cao and Huang model the 2026 compute buildout (NVIDIA funding OpenAI, OpenAI committing to Oracle capacity, bitcoin miners pivoting into GPU colocation) as a circuit where a funding freeze blocks the next hardware refresh, obsolescence craters the collateral behind the debt, and the freeze deepens.
It reduces to one number: how much distress returns to a borrower after one lap around the loop. Below one it dies out, above one it compounds. Their reference scenario lands at 0.98, and two defensible corrections (refusing to count intra-loop revenue as a real buffer, adding idle capacity from weak demand) push it past 1.4.
The useful part is where the fragility sits. Cutting NVIDIA out of the graph barely moves the index, removing the capital-constrained miner cohort moves it a lot, and netting every bilateral exposure does almost nothing, because the binding loop lives inside one balance sheet rather than between two.
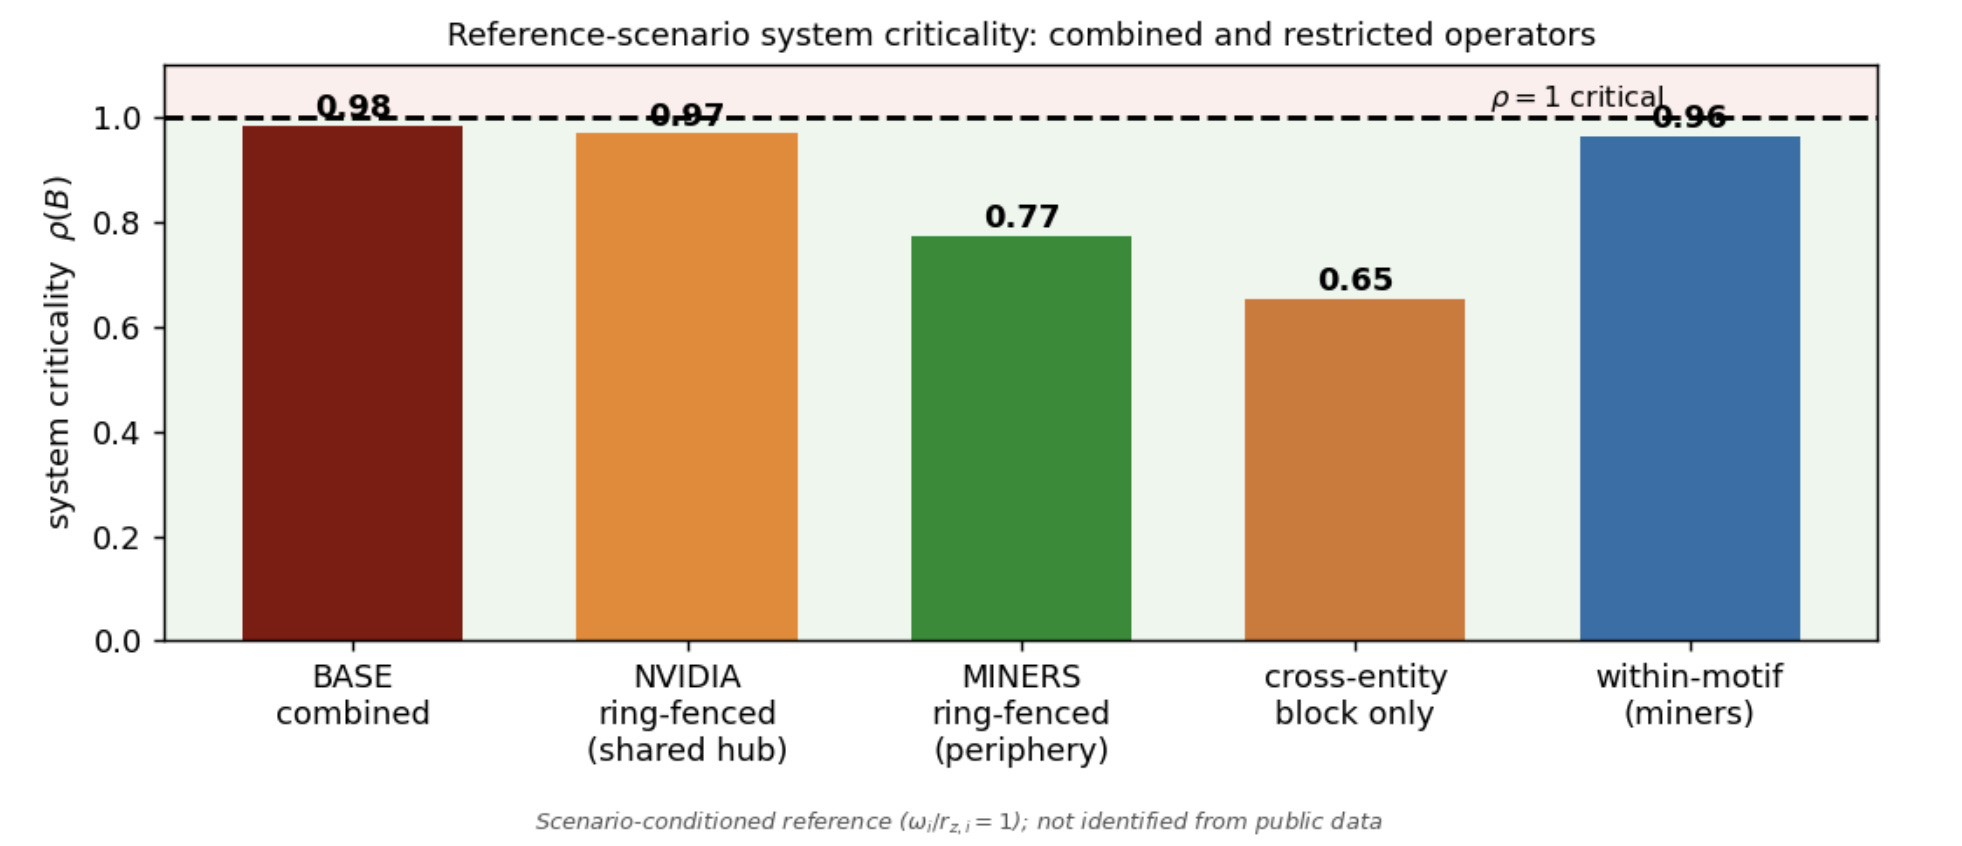
Figure 3: Removing NVIDIA from the network barely changes the system's fragility score. Removing the leveraged miner cohort does.
The authors call these “scenario-conditioned structural diagnostics,” not measurements. Still, the watch list they imply is utilization and the weakest GPU-backed borrowers, not the vendor everyone already monitors.
Cao, Zeyu and Huang, Shaosai, Stability of Compute-Capital Networks: Funding-Technology Feedback and Scenario Diagnostics (July 25, 2026). Available at SSRN: https://ssrn.com/abstract=7295260 or http://dx.doi.org/10.2139/ssrn.7295260
ESG Ratings vs. Portfolio Decarbonization
ESG ratings tell you almost nothing about which companies in a sector actually emit less per dollar of revenue.
Hwang and Patatoukas rank S&P 500 firms against their own sector peers on both ESG scores and carbon intensity (emissions per dollar of revenue), and find the two rankings barely relate. The environmental pillar, which you would expect to be the exception, tracks the composite score so closely that it is effectively the same measure. What drives that pillar explains why: two process indicators, one covering the quality of environmental disclosure and one covering how climate risk is framed in strategy, account for most of the variation. Firms are scored on how well they report and position, not on what they emit.
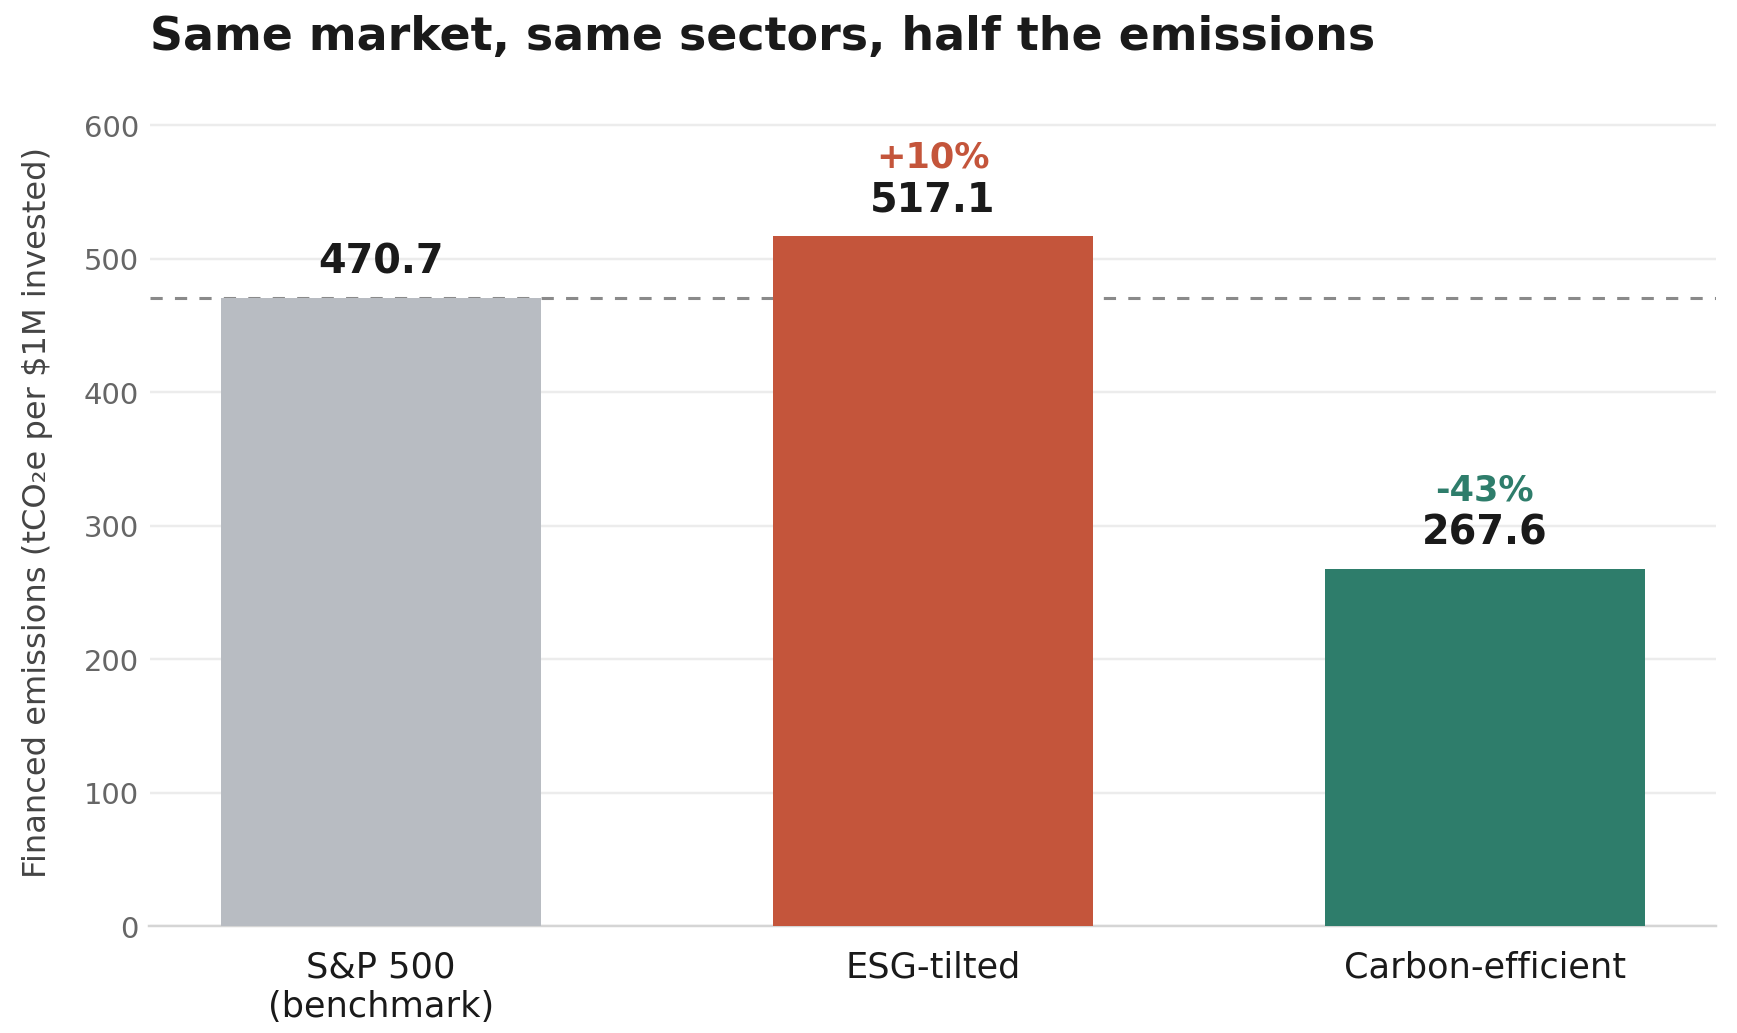
Figure 4: Average annual financed emissions per $1M invested, 2017 to 2024. Recreated from Table 10 (Panel A) of Hwang and Patatoukas (2026). Both tilted indices hold the same sectors in the same proportions as the S&P 500; only the within-sector weights change.
The part that should worry investors is what this does to a portfolio. An index tilted toward carbon-efficient firms cut financed emissions by 43% and matched the market's return. An index tilted toward high ESG scores raised emissions by 10% instead, because the highest scorers tend to be the biggest companies in each sector, and bigger companies emit more in absolute terms regardless of efficiency. As the authors put it, “sustainability ratings and sustainability performance are not the same thing.” If you hold an ESG fund for climate reasons, the label and the outcome are separate purchases.
Patatoukas, Panos N. and Hwang, Jinsung, ESG Ratings Undermine Portfolio Decarbonization. Available at SSRN: https://ssrn.com/abstract=7301860 or http://dx.doi.org/10.2139/ssrn.7301860
This week for paid subscribers
This week for paid subscribers: Paid subscribers are replicating the 2024 Polymarket lead-lag, rebuilding the 34-asset Trump-trade portfolio and testing whether prediction market moves predicted next-day returns in banks, rates, and FX. This post covers turning a noisy directional signal into a percentile-ranked position, a placebo panel that rules out broad equity beta, and where the replication diverges from the paper. Python backtest code included.

Disclaimer: The content provided in this newsletter, "Alpha in Academia," is for informational and educational purposes only. It should not be construed as financial advice, investment recommendations, or an offer or solicitation to buy or sell any securities or financial instruments. Past performance is not indicative of future results. The financial markets involve risks, and readers should conduct their own research and consult with qualified financial advisors before making any investment decisions.
The interpretations, opinions, and analyses presented herein are those of the author and do not necessarily reflect the views of the original researchers, their institutions, or the full implications of the cited academic papers. While every effort is made to accurately represent the research discussed, readers should be aware that the summaries and interpretations may not capture the full scope or nuances of the original studies. The information contained in this newsletter is believed to be accurate and reliable at the time of publication, but accuracy and completeness cannot be guaranteed. The author and publisher accept no liability for any loss or damage resulting from reliance on the information provided.
This newsletter may contain links to external websites or resources. The author is not responsible for the content, accuracy, or reliability of these external sources.
By subscribing to or reading this newsletter, you acknowledge that you have read and understood this disclaimer and agree to hold the author and publisher harmless from any liability that may arise from your use of the information contained herein.