

Welcome back to another issue of Recent Academic Research!
Let’s get into it.
Flexible Forwards in Time-Dependent Models
A widely used shortcut in pricing currency hedges, assuming the optimal exercise trigger moves in a straight line with volatility, turns out to be wrong, and fixing it is now fast enough to do on a trading desk.
Flexible forwards let a company lock in an exchange rate but choose when to actually settle inside a window, which quietly makes them American style options on timing rather than plain forwards. Andersen, Itkin and Kazbek price them under a Heston model whose parameters drift with time, letting the skew stay steep at longer maturities instead of flattening out. The interesting result is not the speed (though pricing a contract in roughly a second, about ten times faster than a fine grid solver, is nice), it is the shape of the exercise surface. Earlier work assumed the trigger price rises linearly with variance. It does not. The curve bends, sometimes sharply, and the bend changes through time.
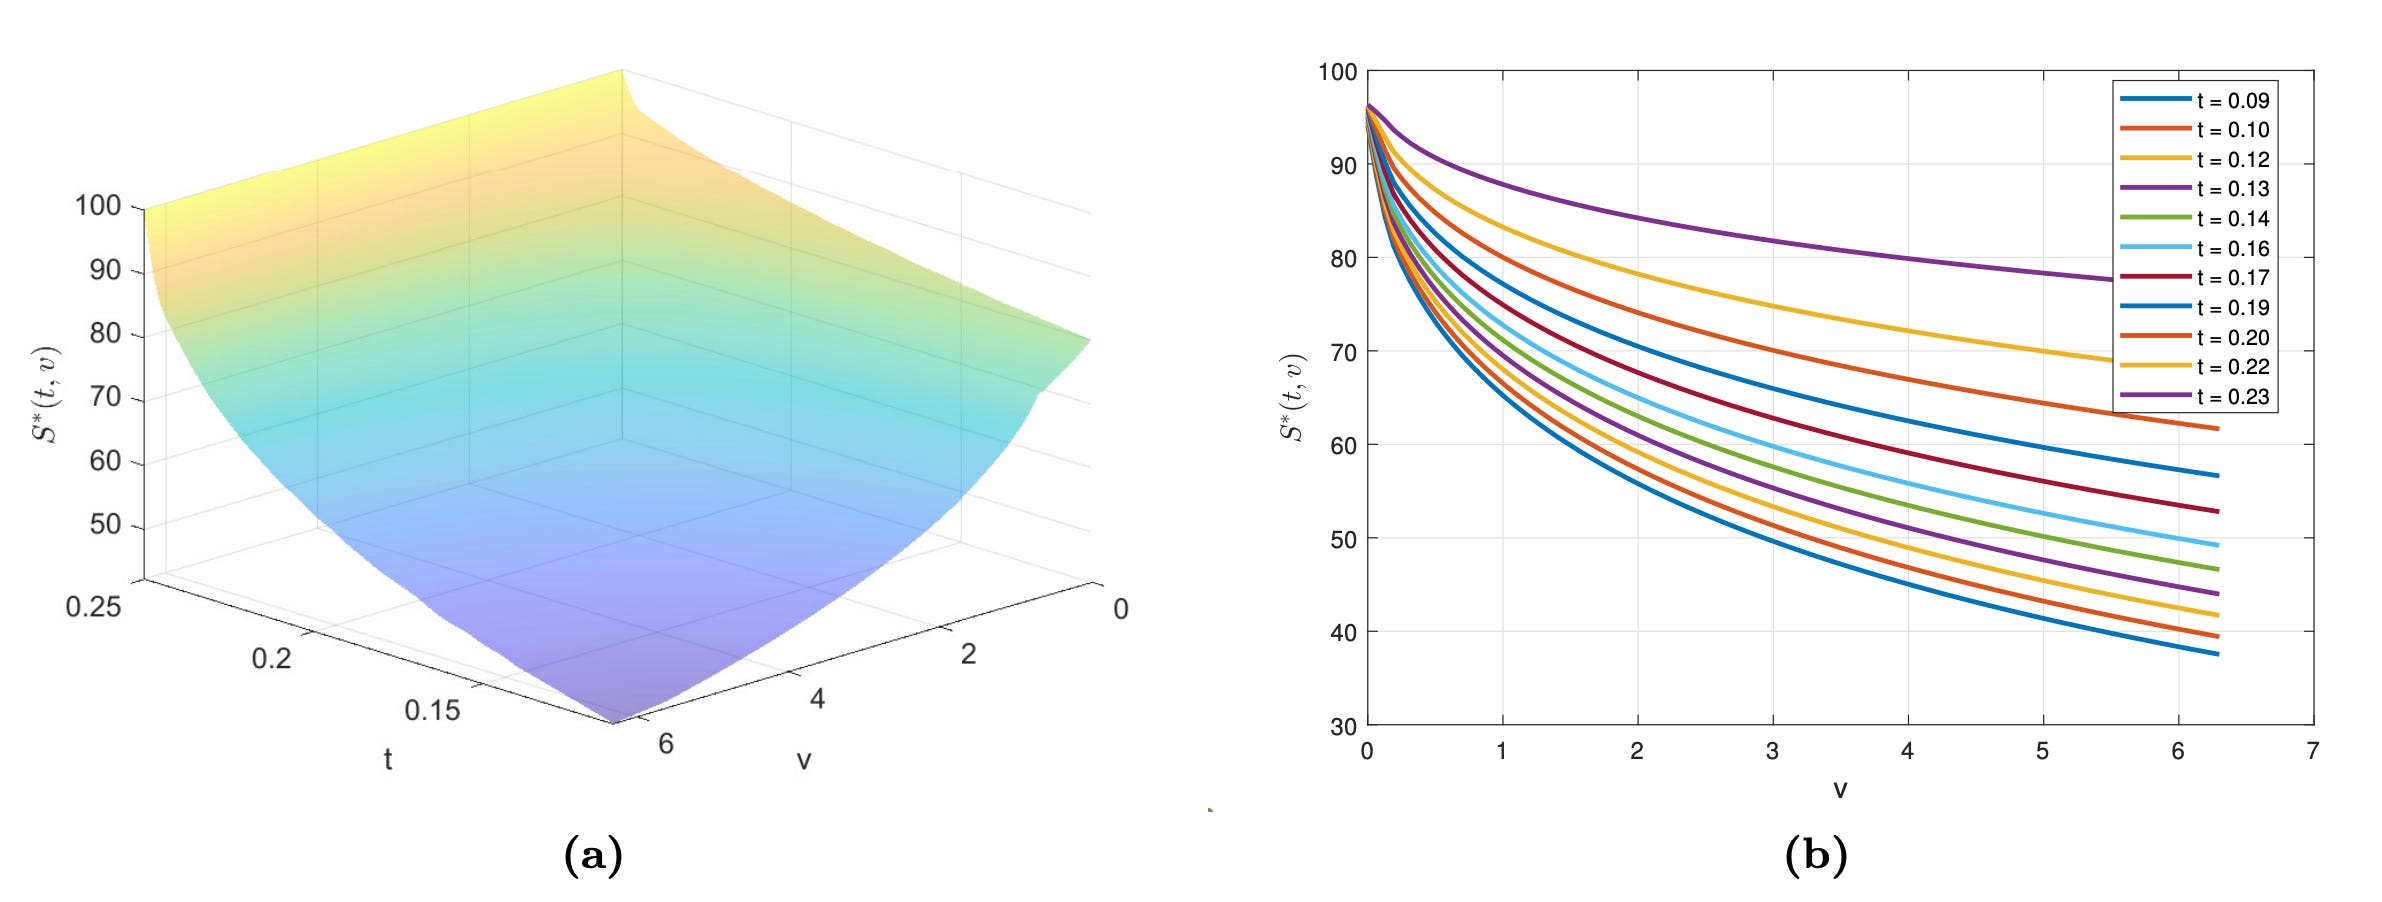
Figure 1: The early exercise surface for an American put: the full surface (left) and slices at fixed dates (right). The curves bend with variance rather than running straight.
Their localized basis method (DSINC) stays accurate where the standard cosine expansion wobbles, roughly twelve times better on median error. In one test the timing option was worth 271 pips versus a typical 50 to 100 pips quoted, which is the kind of gap that eats a sales margin whole.
Andersen, Leif B.G. and Itkin, Andrey and Kazbek, Rakhymzhan, Valuing American options and Flexible Forwards contracts in time-dependent models (June 24, 2026). Available at SSRN: https://ssrn.com/abstract=6991498 or http://dx.doi.org/10.2139/ssrn.6991498
Corporate Bond Dealers Aren't Just Plumbing
Corporate bond dealers quietly telegraph where prices are heading, and almost nobody outside the market is watching.
Dealers in corporate bonds broadcast “axes,” non-binding signals telling clients which bonds they would like to buy or sell. The conventional story says these are housekeeping, dealers nudging inventory back toward comfortable levels, nothing more. This paper, using a huge dataset of axes from the Neptune platform (over eight billion of them, covering most of the US investment grade and high yield indices), finds something more interesting. Bonds dealers signal interest in buying go on to outperform those they want to sell, by roughly 25 basis points over the following month. The telling detail is the shape of the move. Inventory-driven price pressure reverses, because temporary imbalances clear. Dealer interest does not reverse, it keeps drifting in the same direction, which is what information looks like as it seeps into prices.
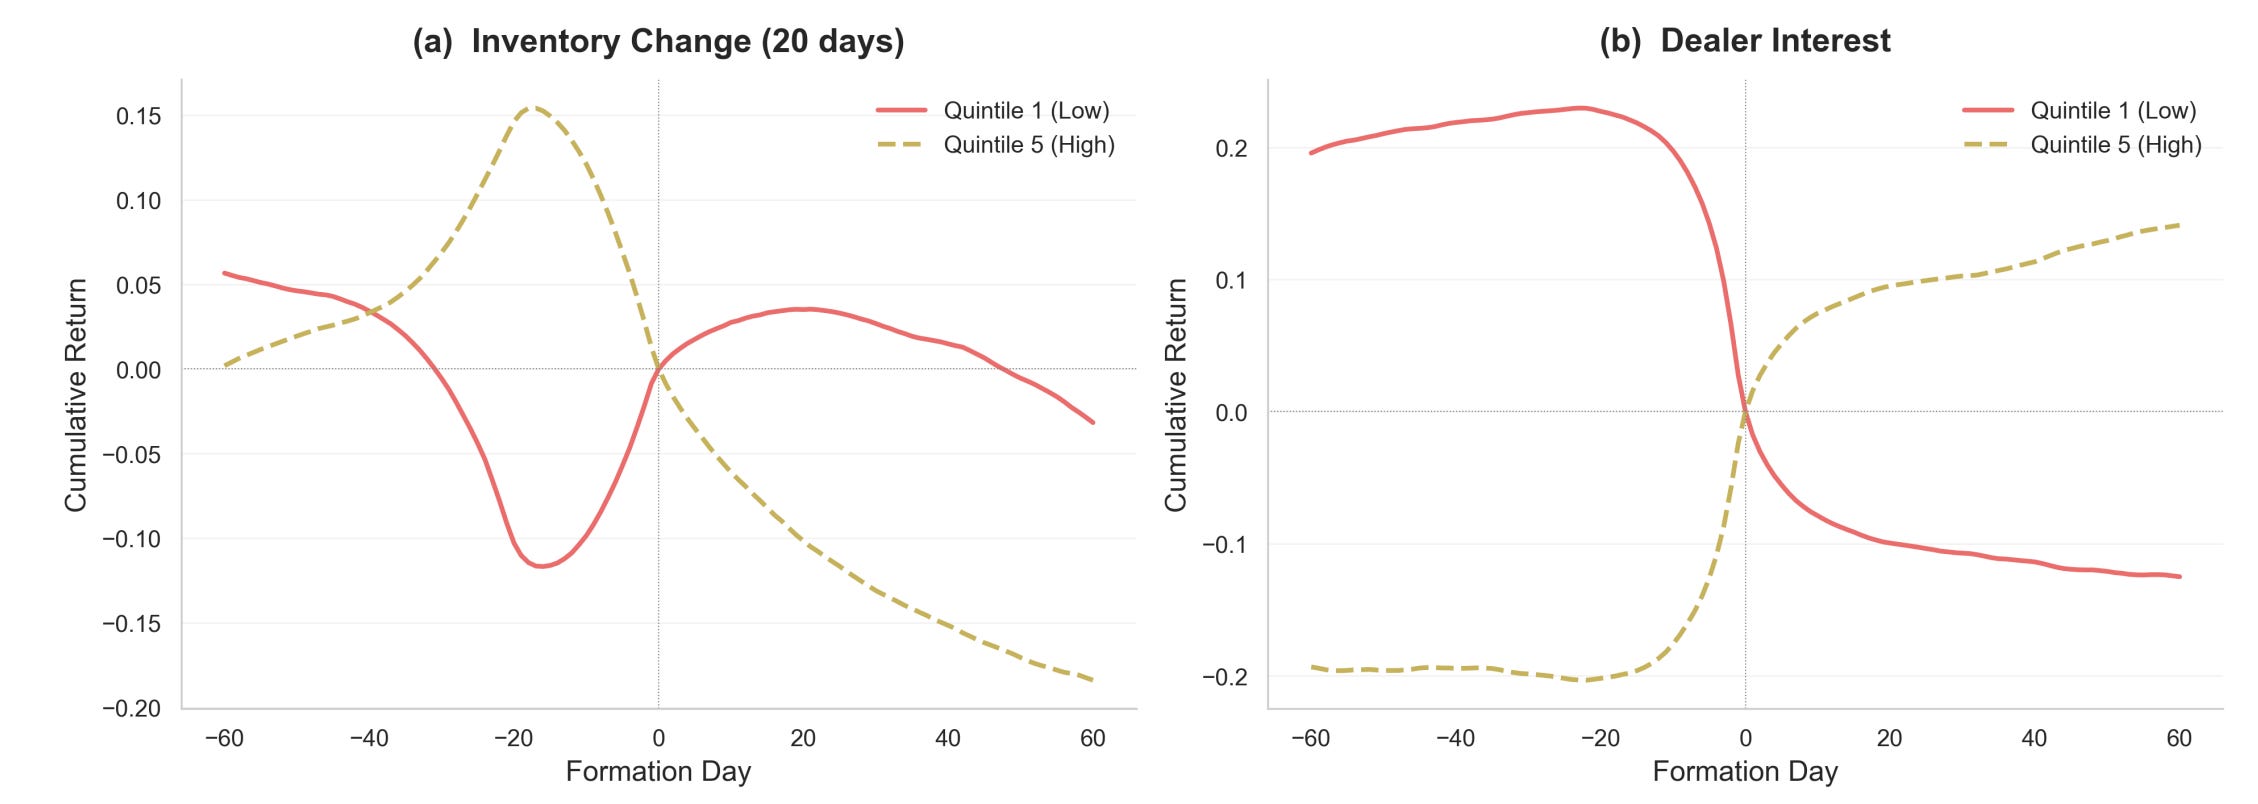
Figure 2: Top and bottom quintiles, tracked 60 days either side of portfolio formation. Sorting on dealer inventory (left) produces the familiar snap back. Sorting on dealer interest (right) produces a drift that keeps going.
The effect is strongest in high yield, where fewer analysts look and information travels slowly, and axes even foreshadow rating upgrades and downgrades. The author concludes that “pre-trade dealer quoting activity may contribute to price discovery.” For investors, that reframes dealers as participants, not plumbing, and suggests the quotes arriving in your inbox carry a signal worth reading.
Geilen, Max, Corporate Bond Dealers and Price Discovery (June 24, 2026). Available at SSRN: https://ssrn.com/abstract=6990060 or http://dx.doi.org/10.2139/ssrn.6990060
Steadier Factors: Anchoring Rolling PCA With Prior Exposures
Nudging a rolling factor model toward an economically sensible starting point makes it far more stable, at little cost to accuracy.
When analysts break multi-asset returns into a few underlying factors, they usually re-run the model each month on a moving window of data. The trouble is that these factors keep drifting: the “growth” factor this month may quietly turn into something else next month, forcing constant rebalancing and muddying any story about what is actually driving returns. The authors add a gentle pull toward a prior set of exposures grounded in economic intuition, then let the data decide how hard to pull. At a moderate setting, year-ahead factor drift shrinks by roughly a quarter and the turnover of factor-mimicking portfolios falls noticeably, while the model's ability to reconstruct next month's returns barely moves.
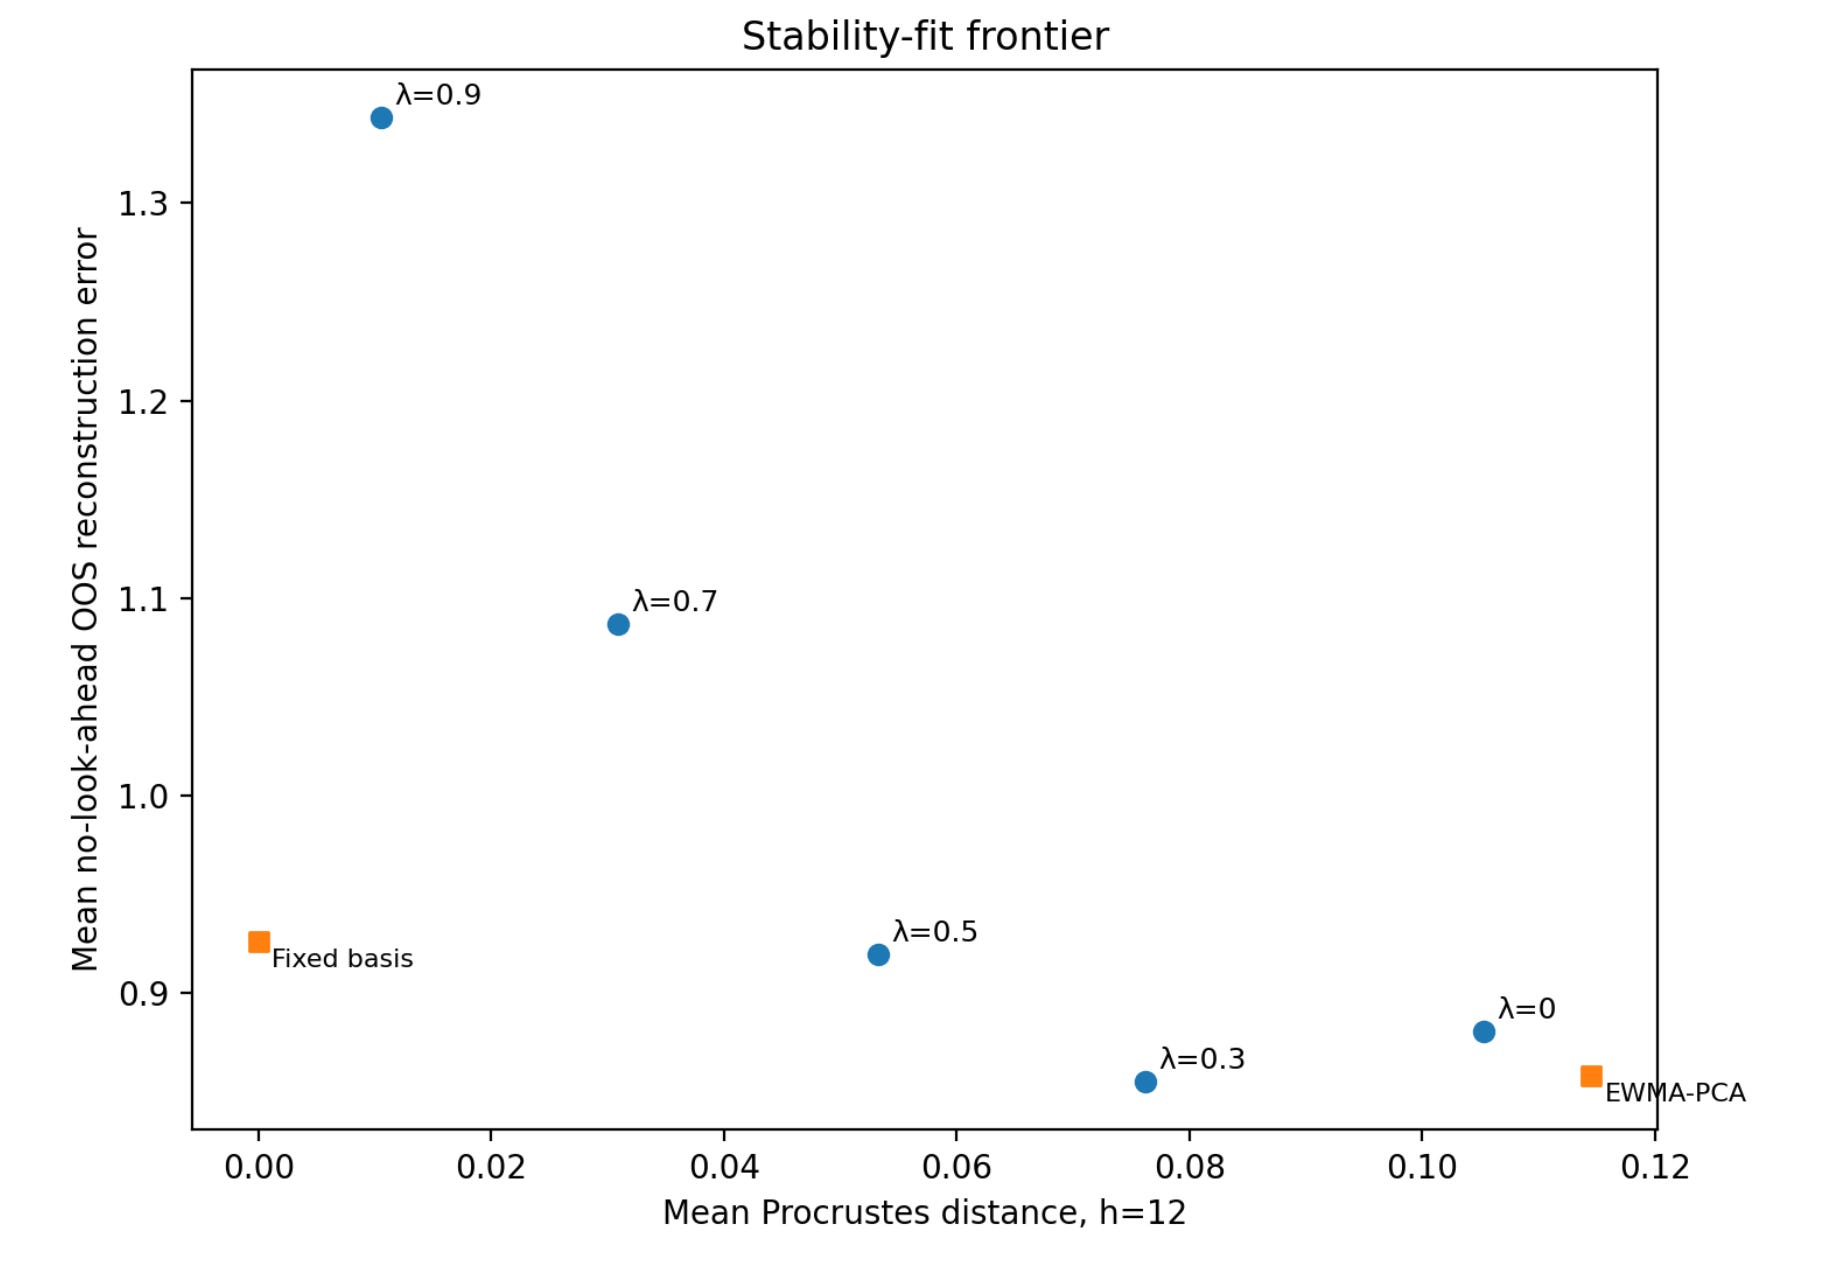
Figure 2: Each point is a regularization strength. Left means steadier factors, down means better fit. The moderate setting (λ = 0.3) wins on both.
Push too hard and the model just parrots the prior, so the sweet spot is deliberately mild. Tested on nearly a century of US stock portfolios and dropped into a minimum-variance strategy, the stabilized version preserved risk performance while trimming both trading and drawdown. For investors, that means lower turnover costs and factor attributions you can trust from one month to the next.
Nakagawa, Kei and Kato, Masahiro and Imamura, Mitsuyoshi, Subspace Regularized Principal Component Analysis Using Prior Exposure Information (June 25, 2026). Available at SSRN: https://ssrn.com/abstract=6993538
Risky Oil: Betting on the Tails
A machine learning model built to bend around extreme events forecasts oil price tails better than the linear workhorses most analysts still rely on.
Forecasting the average future oil price is one thing; forecasting the ugly surprises at either end of the distribution is what actually keeps producers, airlines, and central bankers awake. This paper pits three approaches against each other and finds that a flexible machine learning model (which lets relationships between oil and its drivers stay linear when that suffices, but bends into nonlinear shapes when markets go haywire) consistently produces the sharpest tail forecasts.
A stochastic-volatility Bayesian VAR comes a close second, while the popular quantile regression approach barely beats a naive no-change forecast. The edge widens as the forecast horizon lengthens, and it holds even against a benchmark that already accounts for shifting volatility, so the gains come from capturing genuine nonlinearity rather than just noisier noise.
Demand factors drive the downside, supply factors drive the upside, and the authors show these tail signals even help predict Fed rate moves. For anyone hedging oil exposure or pricing energy risk, the takeaway is that allowing for nonlinearities when forecasting oil prices matters most precisely when it is hardest, during the turbulent episodes that break simpler models.
Baumeister, Christiane and Huber, Florian and Marcellino, Massimiliano, Risky Oil: It's All in the Tails. Available at SSRN: https://ssrn.com/abstract=7118662 or http://dx.doi.org/10.2139/ssrn.7118662
This week for paid subscribers
Paid subscribers are getting a from-scratch DCC-GARCH check on whether gold, silver, wheat, and corn actually hedged four US equity sectors around COVID, going beyond theoretical hedge ratios to measure realized volatility reduction. We find gold's hedge against financials didn't just weaken but briefly flipped to increasing portfolio risk, silver grew more entangled with materials, and corn quietly outperformed its weak-safe-haven billing as the most consistent volatility reducer in the study. Python backtest code and data included.

Disclaimer: The content provided in this newsletter, "Alpha in Academia," is for informational and educational purposes only. It should not be construed as financial advice, investment recommendations, or an offer or solicitation to buy or sell any securities or financial instruments. Past performance is not indicative of future results. The financial markets involve risks, and readers should conduct their own research and consult with qualified financial advisors before making any investment decisions.
The interpretations, opinions, and analyses presented herein are those of the author and do not necessarily reflect the views of the original researchers, their institutions, or the full implications of the cited academic papers. While every effort is made to accurately represent the research discussed, readers should be aware that the summaries and interpretations may not capture the full scope or nuances of the original studies. The information contained in this newsletter is believed to be accurate and reliable at the time of publication, but accuracy and completeness cannot be guaranteed. The author and publisher accept no liability for any loss or damage resulting from reliance on the information provided.
This newsletter may contain links to external websites or resources. The author is not responsible for the content, accuracy, or reliability of these external sources.
By subscribing to or reading this newsletter, you acknowledge that you have read and understood this disclaimer and agree to hold the author and publisher harmless from any liability that may arise from your use of the information contained herein.