

Welcome back to another issue of Recent Academic Research!
Let’s get into it.
The Activeness Hiding in Passive Investing
Japanese index funds built on niche themes charge higher fees, attract investors who stop paying attention to those fees, and then go on to underperform.
Japan has moved into passive investing faster than the US. As plain market trackers raced toward zero fees, fund managers found a way out: launch index funds on AI, robotics, semiconductors and other catchy themes. Looking at two decades of Japanese index funds and ETFs, Anan finds that many of these “passive” products deviate from the market about as much as a typical stock picker’s fund.
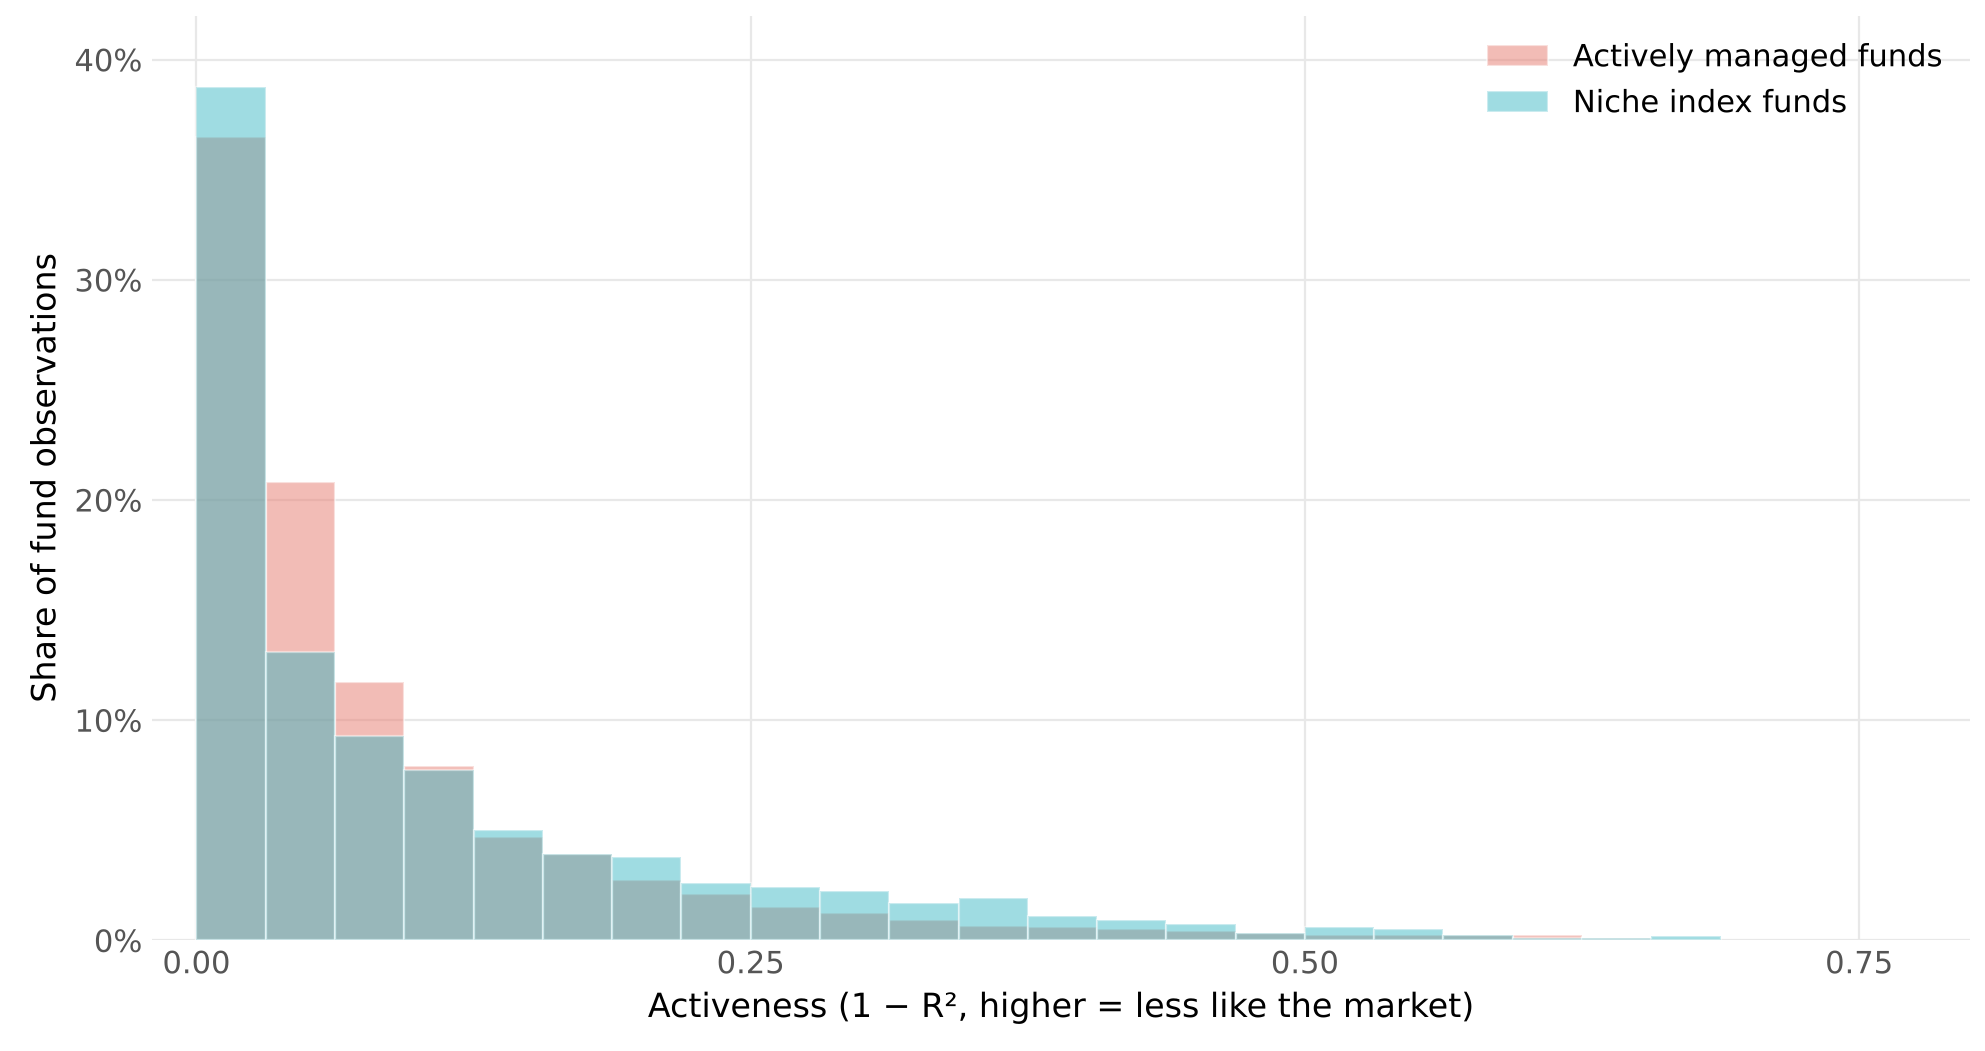
Figure 1: Niche index funds (teal) deviate from the market about as much as actively managed funds (pink), and in the high-activeness tail they often deviate more. Chart recreated from Figure 2 of Anan, “Activeness in Passive Investing: Evidence from Japanese Index Funds.”
That activeness comes with higher fees. The more surprising part is investor behavior. People buying these funds are noticeably less sensitive to fees and chase recent performance harder. It sadly doesn’t pay off though. Among niche funds, a typical step up in activeness costs roughly 1 to 1.5 percentage points of risk adjusted return a year, even when comparing funds within the same category, and the gap has grown over the last decade. The author warns that “niche index funds may function as a structural trap.” And this lesson applies well beyond Tokyo. Calling something an index fund doesn’t make it cheap, diversified or passive. What you’re really buying is the index designer’s bet.
Anan, Anju, Activeness in Passive Investing: Evidence from Japanese Index Funds. Available at SSRN: https://ssrn.com/abstract=7578303 or http://dx.doi.org/10.2139/ssrn.7578303
Graduated Trading Restrictions and the Expiry Day Rebound
Borsa Istanbul’s toughest volatility curbs don’t calm overheated stocks so much as pause them, and the trading comes back on the day the restrictions expire.
When a small Turkish stock rockets on a wave of retail buying, Borsa Istanbul can hit it with escalating restrictions. These start with bans on short selling and margin buying, move up to a rule that forces every trade to settle in full (so shares bought today can’t be sold the same day), and end with periodic auctions in place of continuous trading. The first step barely registers. The settlement rule does the real work, wiping out roughly two thirds of trading value while each lira that still trades moves the price far more.
The paper’s method for proving this is clever. Every measure comes with a preset end date, and when the exchange lengthened those windows from two weeks to about a month, the rebound in trading shifted with the calendar and landed right on expiry day.
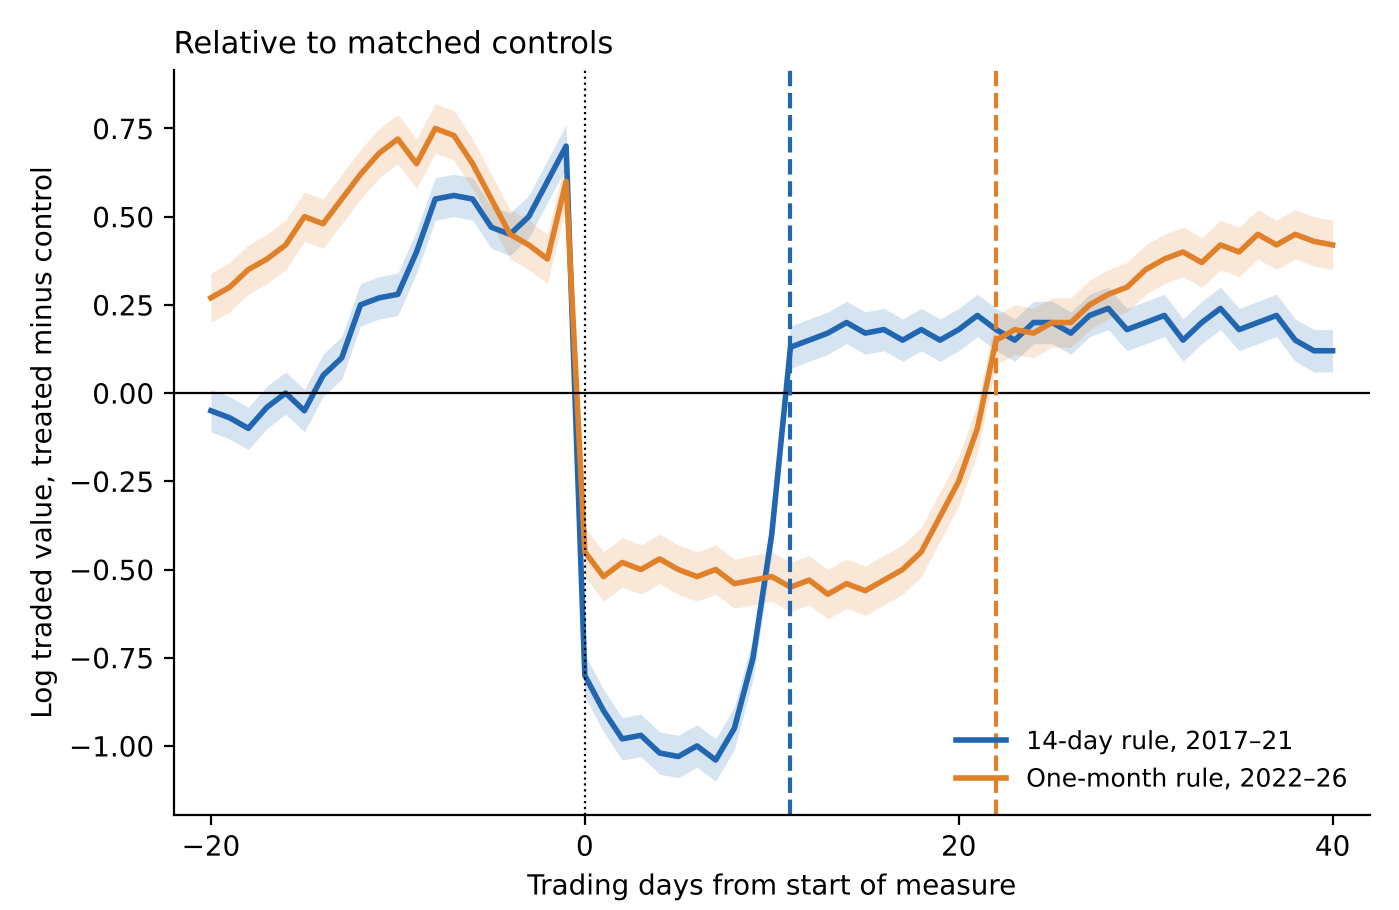
Figure 2: Trading in stocks placed under gross settlement, relative to similar unrestricted stocks. Activity drops the day the rule starts and recovers on its scheduled end date, about 11 trading days later under the old two week rule and about 22 under the newer one month rule. Chart redrawn from Fig. 3a of Apaydın, “Graduated trading restrictions and market stability.”
Apaydın believes that the system “mainly postpones trading in the restricted stocks.” Flagged names do give back part of their run up in the following months, though that may just be ordinary mean reversion after a big rally. For anyone chasing momentum in emerging markets, a regulatory flag works like a liquidity freeze with a known end date. It says little about whether the stock is fairly priced.
Apaydın, Can, Graduated trading restrictions and market stability: Evidence from Borsa Istanbul's volatility-based measure system. Available at SSRN: https://ssrn.com/abstract=7577947 or http://dx.doi.org/10.2139/ssrn.7577947
When Hedging Changes the Payoff
When a large trader hedges an option, the hedge itself moves the price that decides what the option pays.
Classic option pricing assumes the hedger is invisible, buying and selling stock without nudging its price. Researchers at LSE and Oxford drop that assumption and find the problem becomes circular. A dealer hedging a call buys shares, which lifts the price, which raises the call’s payoff, which requires an even bigger hedge. They show this moving target can still be hedged perfectly for calls and puts, but always at a higher cost than the textbook price.
In effect, the strike drifts lower by an amount tied to the size of the hedge, so dealers end up holding more stock than standard delta (the usual hedge ratio) would suggest. Size matters a lot. As the authors note, “price impact introduces a nonlinear dependence on the number of contracts,” so a bigger position raises the cost of each contract, not just the total.
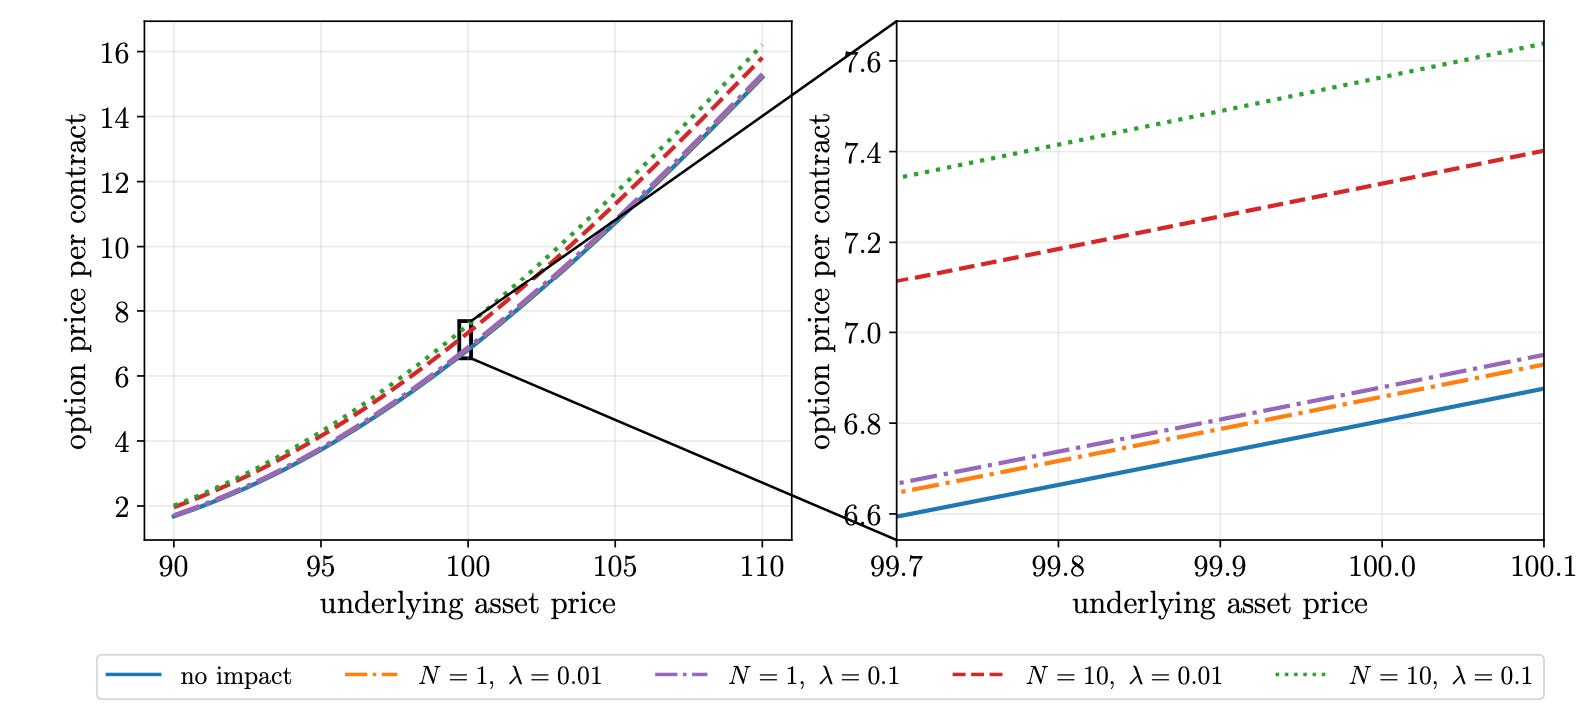
Figure 3: Call option price per contract around a $100 stock. The solid blue line is the classic price with no market impact. Each line above it adds friction, and hedging 10 contracts in a high impact market (dotted green) costs the most per contract.
In their simulations, about 1 in 100 options expired in the money only because of the hedger’s own buying. Same day expiry options now make up most S&P 500 index option volume, so this effect is practical. Large dealer hedges can move closing prices, and the option prices you pay already include that feedback.
Itkin, David and Sánchez-Betancourt, Leandro, When Hedging Changes the Payoff: Option Replication with Price Impact and Execution Costs (September 30, 2026). Available at SSRN: https://ssrn.com/abstract=7555822 or http://dx.doi.org/10.2139/ssrn.7555822
Agents Propose, Code Decides, the Market Disposes
AI agents can now run an entire stock factor search on their own, and the honest result is a model that kept its ranking skill on new data but lost most of its profit.
Sadeghi handed one of quant finance’s most error prone chores to a team of Claude agents: Test every published stock predictor and keep only the ones that add something new. The twist is that the agents decide what to test, while fixed code decides how each test is scored. The rules, the testing order and even the expectations for the final exam were all written down before any results existed. In three days the loop worked through all 212 predictors in a public catalogue, kept a small fraction, and sharply improved the model’s ability to rank stocks on historical data.
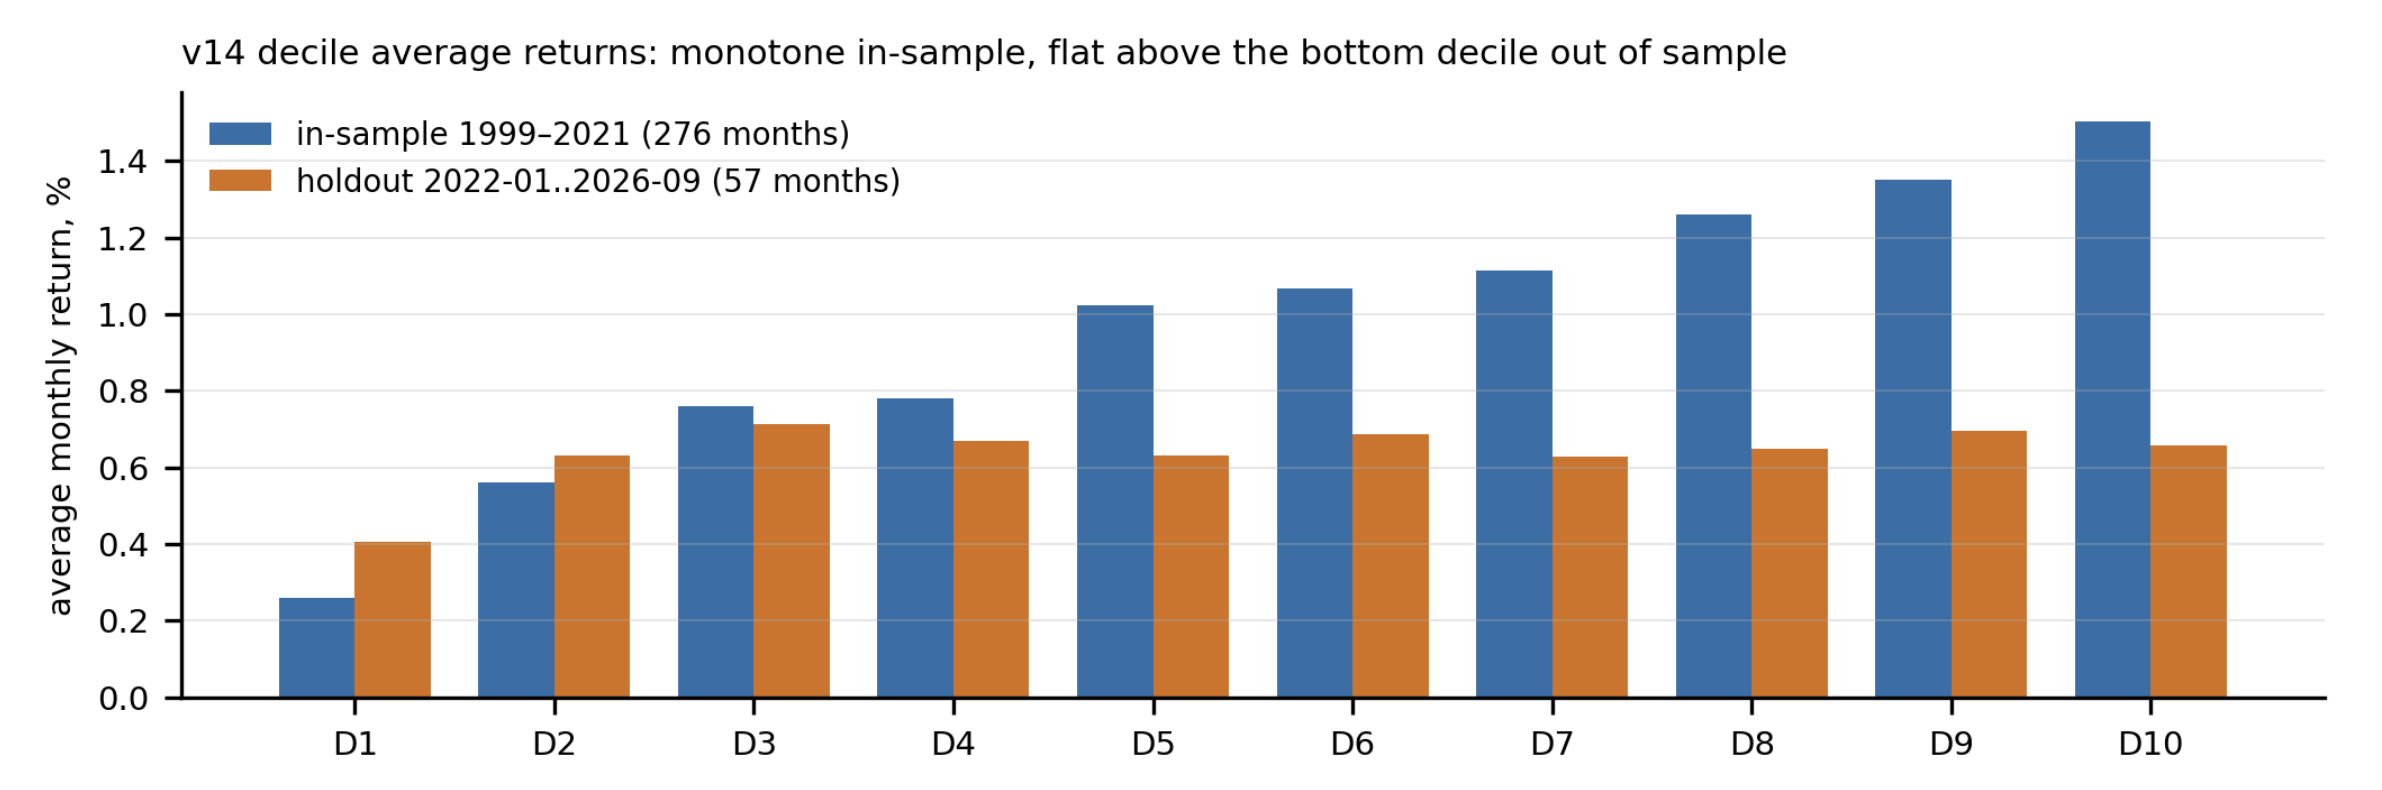
Figure 4: Average monthly return for each tenth of stocks, ranked from worst (D1) to best (D10) by the AI-built model. In the historical data, returns climb steadily with the ranking. On new data, the model still flags the stocks to avoid, but the other nine groups earn almost the same.
On the untouched recent data, that ranking skill mostly held up, but the PnL could not keep up. The strategy earned roughly half its expected risk adjusted return, and much of it came from a market hedge riding a rising market rather than from stock picking. For investors, the lesson is that ranking stocks well and profiting from it are different things, and writing expectations down first “makes a mixed result reportable rather than a disappointment to be explained away.”
Sadeghi, Erfan, Agents Propose, Code Decides: An Autonomous Research Loop Framework to Build an Equity Alpha Model (October 05, 2026). Available at SSRN: https://ssrn.com/abstract=7568638 or http://dx.doi.org/10.2139/ssrn.7568638
Disclaimer: The content provided in this newsletter, "Alpha in Academia," is for informational and educational purposes only. It should not be construed as financial advice, investment recommendations, or an offer or solicitation to buy or sell any securities or financial instruments. Past performance is not indicative of future results. The financial markets involve risks, and readers should conduct their own research and consult with qualified financial advisors before making any investment decisions.
The interpretations, opinions, and analyses presented herein are those of the author and do not necessarily reflect the views of the original researchers, their institutions, or the full implications of the cited academic papers. While every effort is made to accurately represent the research discussed, readers should be aware that the summaries and interpretations may not capture the full scope or nuances of the original studies. The information contained in this newsletter is believed to be accurate and reliable at the time of publication, but accuracy and completeness cannot be guaranteed. The author and publisher accept no liability for any loss or damage resulting from reliance on the information provided.
This newsletter may contain links to external websites or resources. The author is not responsible for the content, accuracy, or reliability of these external sources.
By subscribing to or reading this newsletter, you acknowledge that you have read and understood this disclaimer and agree to hold the author and publisher harmless from any liability that may arise from your use of the information contained herein.