

Welcome back to another issue of Recent Academic Research!
Let’s get into it.
Alpha from Mandelbrotian Prices
The most accurate option pricing model turned out not to be the most profitable one.
The authors ran five pricing models against S&P 500 option chains, then turned each into a simple trading rule: buy when the model says the market price is too low, sell when it says the market price is too high. On raw accuracy, classical Black-Scholes held up remarkably well, landing closest to actual prices across most medium and long dated contracts, which is a little annoying given how many of its assumptions are known to be false. But when those same models became strategies, Black-Scholes finished fifth out of nine. The winner was Mandelbrot's multifractal model, which treats prices as rough and self-similar rather than smoothly random, and which more than tripled starting capital in the backtest.
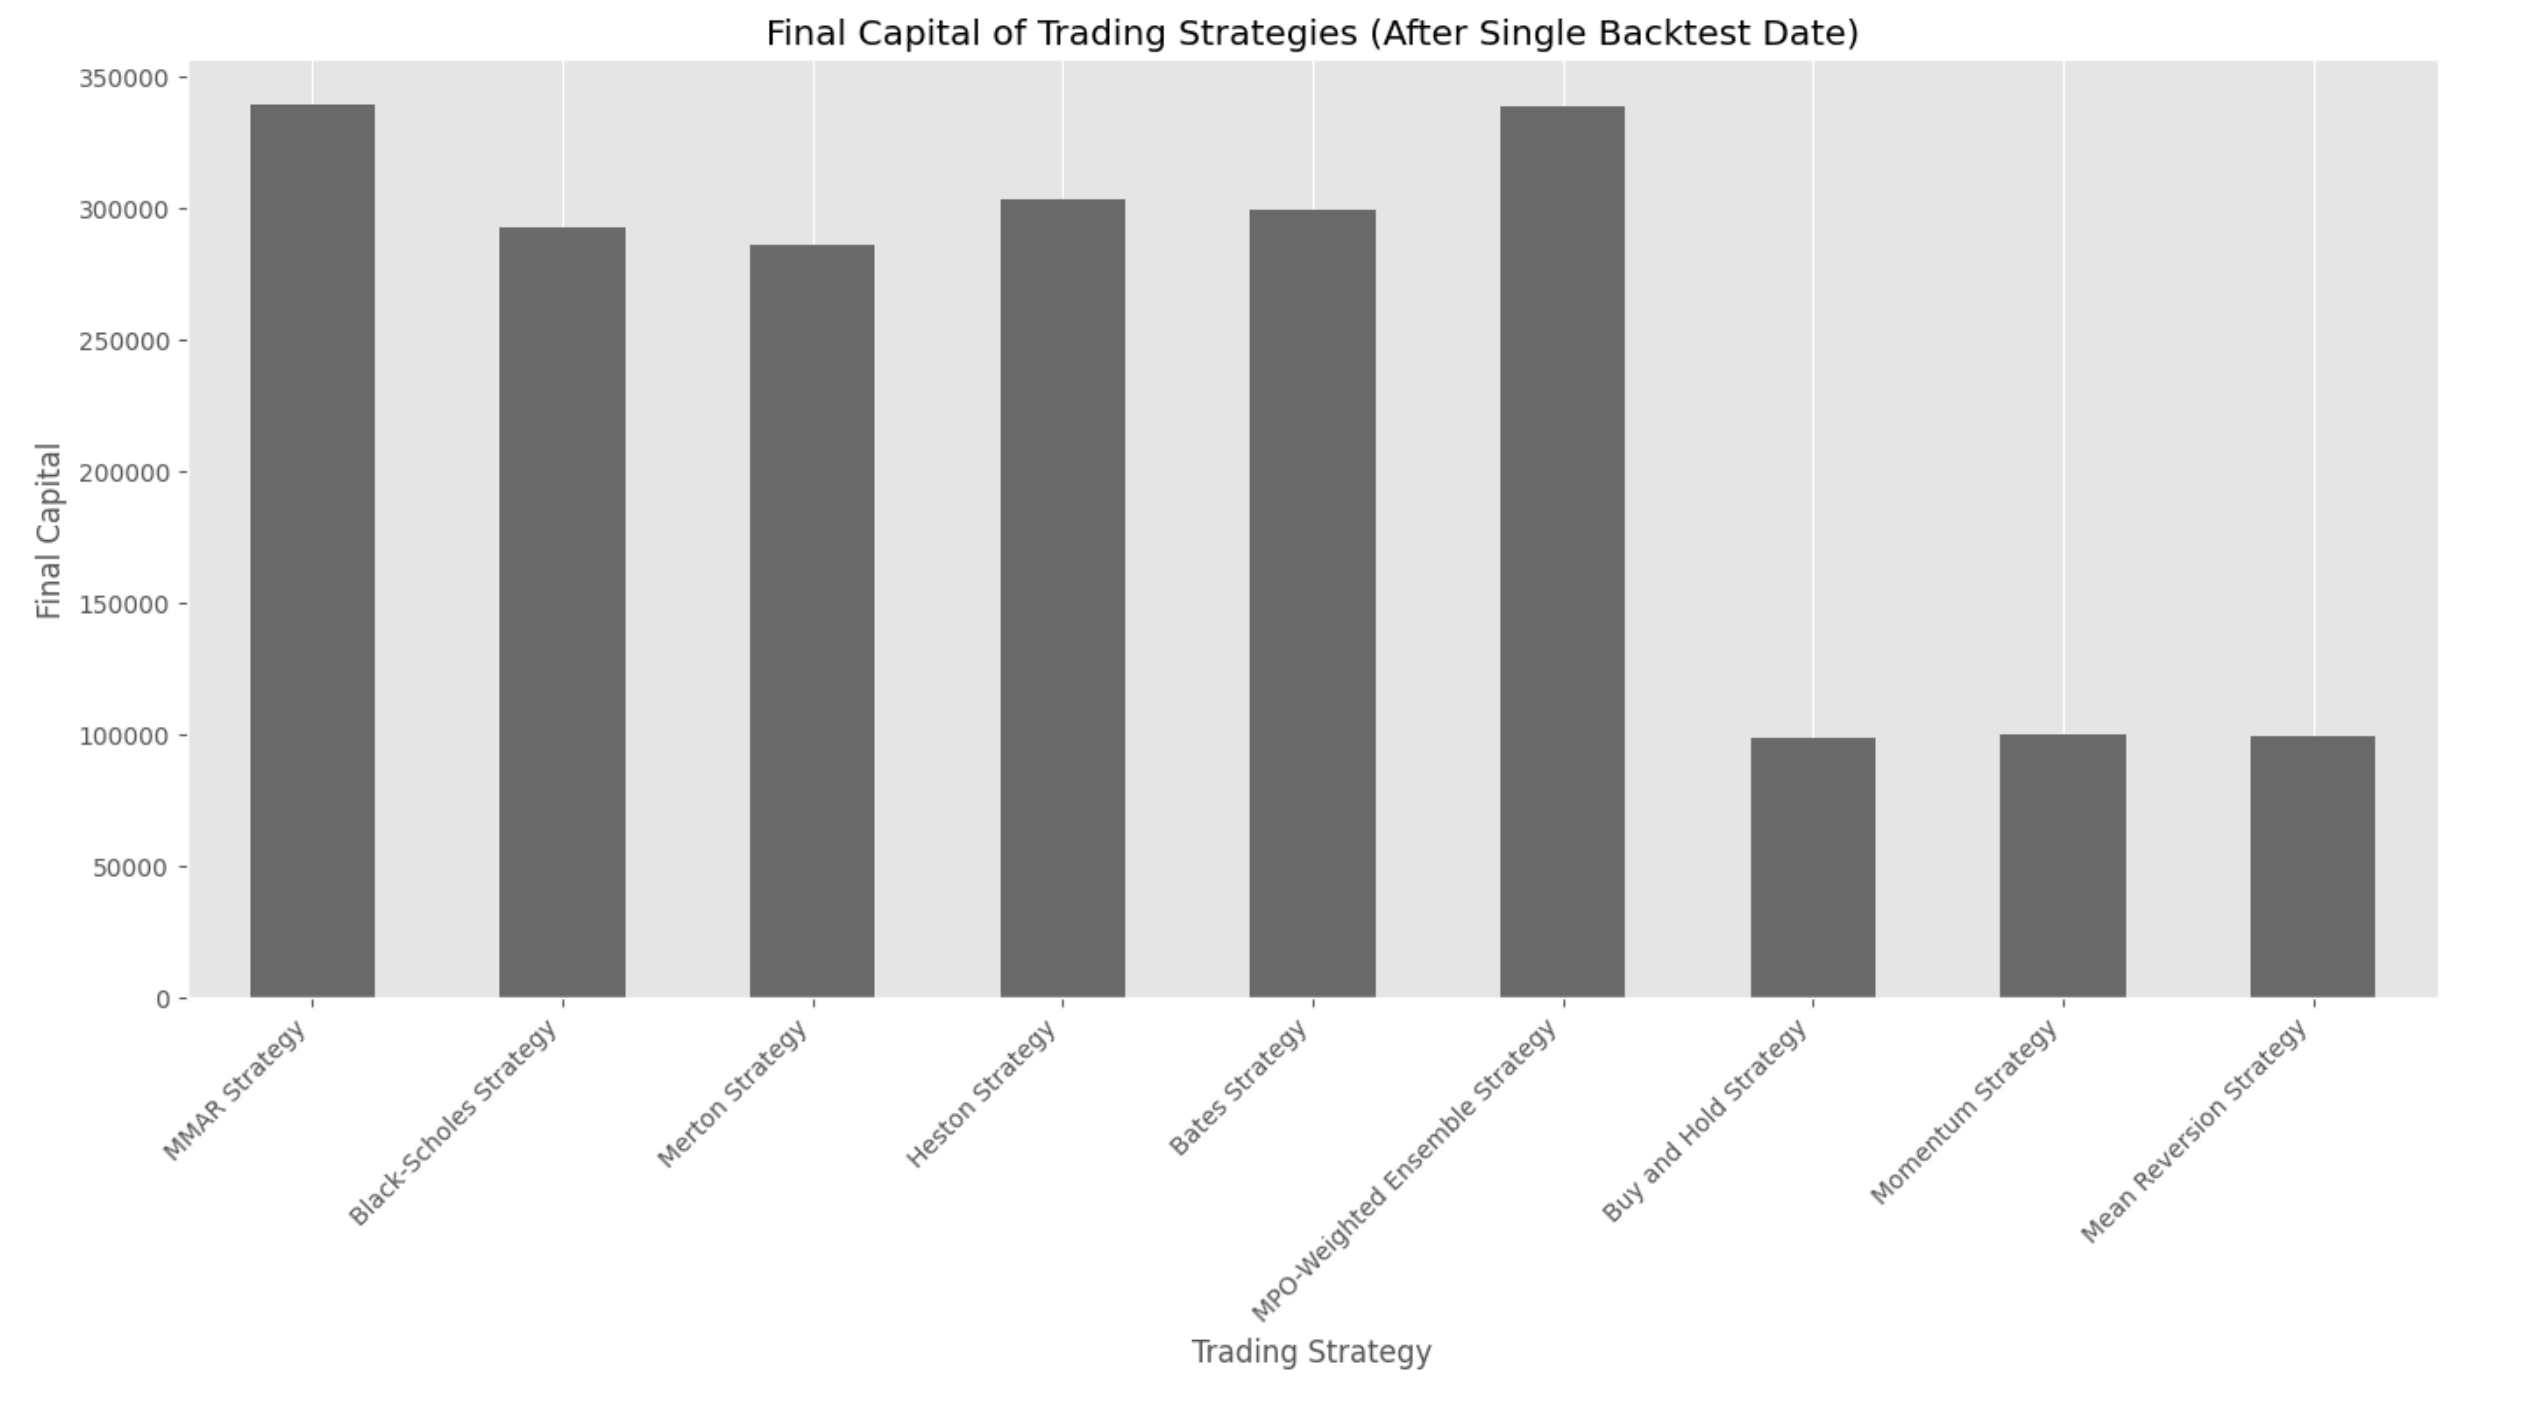
Figure 1: Every model-based strategy roughly tripled its starting capital. Buy-and-hold, momentum, and mean reversion finished essentially flat. Note that Black-Scholes, the most accurate pricer in most categories, sits mid-pack here.
The paper says it plainly, noting that “accuracy in option price calculation does not always translate” into trading results. The catch is that data limits confined the backtest to a single date in 2023, so read this as proof of concept, not verified edge. The broader lesson still holds, that the model that best explains yesterday's prices is not automatically the one that finds tomorrow's mispricings.
Bhattacharyya, Ritabrata and Goh, Zhi Hwee and Korovedzai, Rudairo Orpah and Chen, Jun-Han, Alpha Generation using Option Trading Strategies based on Modeling Options Prices considering Mandelbrotian Movement of Prices (July 21, 2026). Available at SSRN: https://ssrn.com/abstract=7154800 or http://dx.doi.org/10.2139/ssrn.7154800
ETF (Mis)pricing: Blame the Inventory
ETF prices drift from the value of their underlying holdings largely because the firms responsible for keeping the two aligned run into inventory limits, not because the underlying assets are broken.
Authorized Participants (the large trading firms permitted to create and redeem ETF shares) are supposed to arbitrage away any gap between an ETF's market price and the value of its basket. Using FCA regulatory data covering 128 UK listed ETFs from 2018 to 2022, the authors observe each firm's daily inventory directly for the first time, and the pattern is consistent. When an AP holds more ETF shares than it wants, it quotes cheaper prices to offload them, and the fund slips to a discount. The adjustment shows up almost entirely in the ETF price, while NAV barely responds.
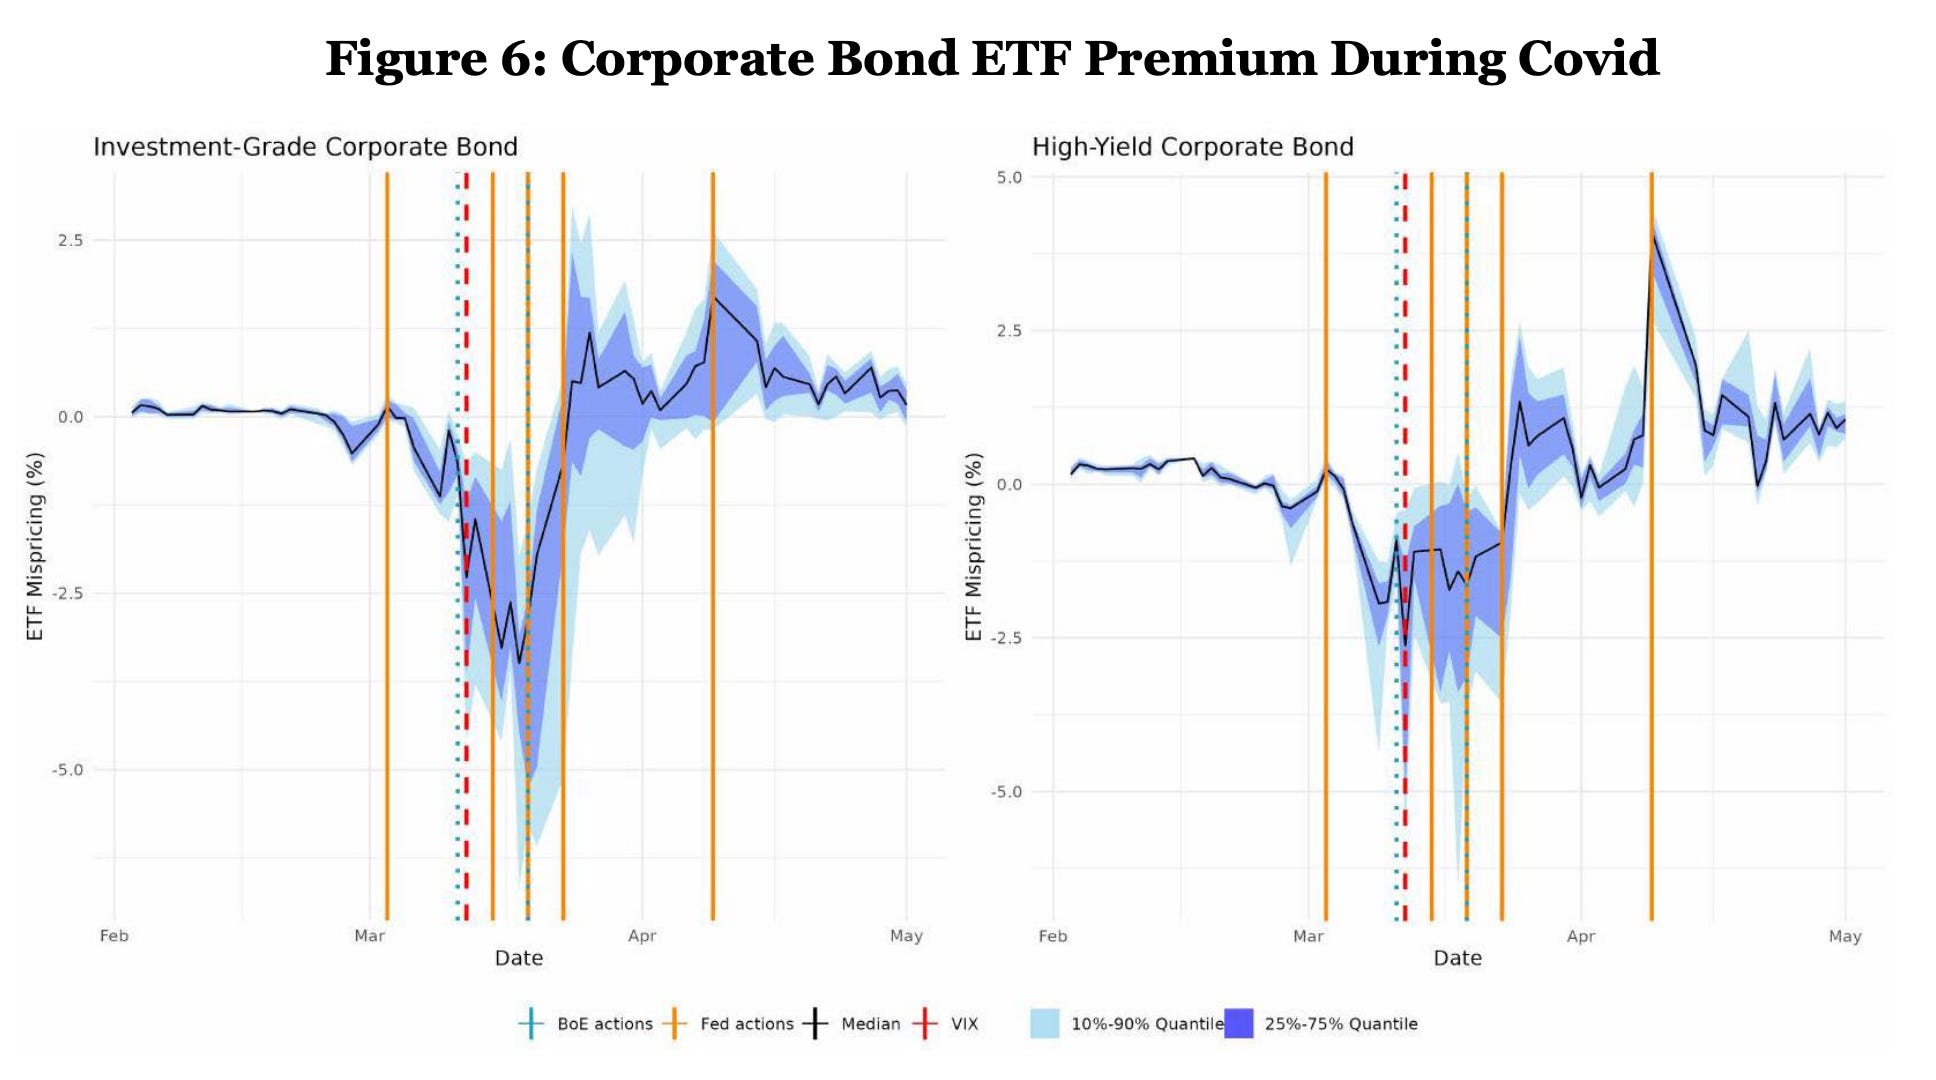
Figure 2: Corporate bond ETFs, February to May 2020. Median price to NAV gap (black), spread across funds (bands), Fed and BoE interventions (vertical lines). The gap closes as policy eases dealer funding pressure.
The effect also splits by asset class, with equity ETFs more sensitive to inventory and bond ETFs more sensitive to unexpected order flow. APs sometimes take directional positions instead of correcting gaps immediately, which undercuts the assumption that arbitrage is instantaneous. For investors, this reframes premiums and discounts (bond ETFs moved over 5% from NAV in March 2020) as a read on dealer capacity rather than fund quality, since inventory practices “can exacerbate mispricing, particularly during periods of stress.”
Kraus, Wladimir and Kirilenko, Andrei A. and Linton, Oliver B. and Xiao, Mingmei, ETF (Mis)Pricing (May 25, 2025). Available at SSRN: https://ssrn.com/abstract=7143458 or http://dx.doi.org/10.2139/ssrn.7143458
Climate Attention and the Bond Market
Public curiosity about global warming, measured by Google searches, predicts higher returns on U.S. Treasury bonds over the following year.
The authors built a monthly index of worldwide searches for “global warming” and test whether it forecasts the excess return Treasuries earn over cash. It does, and not marginally. Higher search interest reliably precedes higher bond returns across maturities from two years all the way out to twenty four, and the relationship survives controls for the yield curve, the standard bond forecasting factors, and five separate uncertainty measures.
More impressively, the signal holds up out of sample, where most predictors quietly die, cutting forecast errors by roughly 15% against the historical average benchmark. The mechanism is less exotic than it sounds. Rising climate attention travels with expectations of a softer economy (weaker production, higher unemployment) and a tilt toward safer assets, so investors mark down the expected path of policy rates. The effect sits almost entirely in expected short rates rather than term premia, and it barely existed before the Paris Agreement. For investors, that suggests attention data can proxy for shifts in macro expectations before conventional indicators register them.
Yu, Deshui and Tang, Jiachen and Li, Luyang and Zhou, Mingtao, Climate Attention and Treasury Bond Risk Premia. Available at SSRN: https://ssrn.com/abstract=7203448 or http://dx.doi.org/10.2139/ssrn.7203448
Trading on Language Models Under Market Frictions
Large language models beat word-counting sentiment on financial news, but their edge lives almost entirely in the sentences where meaning depends on structure rather than vocabulary.
The authors push nearly a million firm specific news stories through six sentiment engines, from the classic Loughran McDonald word list to an 8 billion parameter LLaMA-3, then force every signal through the frictions an actual desk faces (trades happen only after the news was genuinely observable, positions pay spreads and costs, and no trade can exceed a tenth of a stock's daily volume). The word list barely beats a coin flip and loses money once turnover is paid for. The decoder models survive, with LLaMA-3 posting the strongest net long short performance in a test window chosen to sit after its own training cutoff.
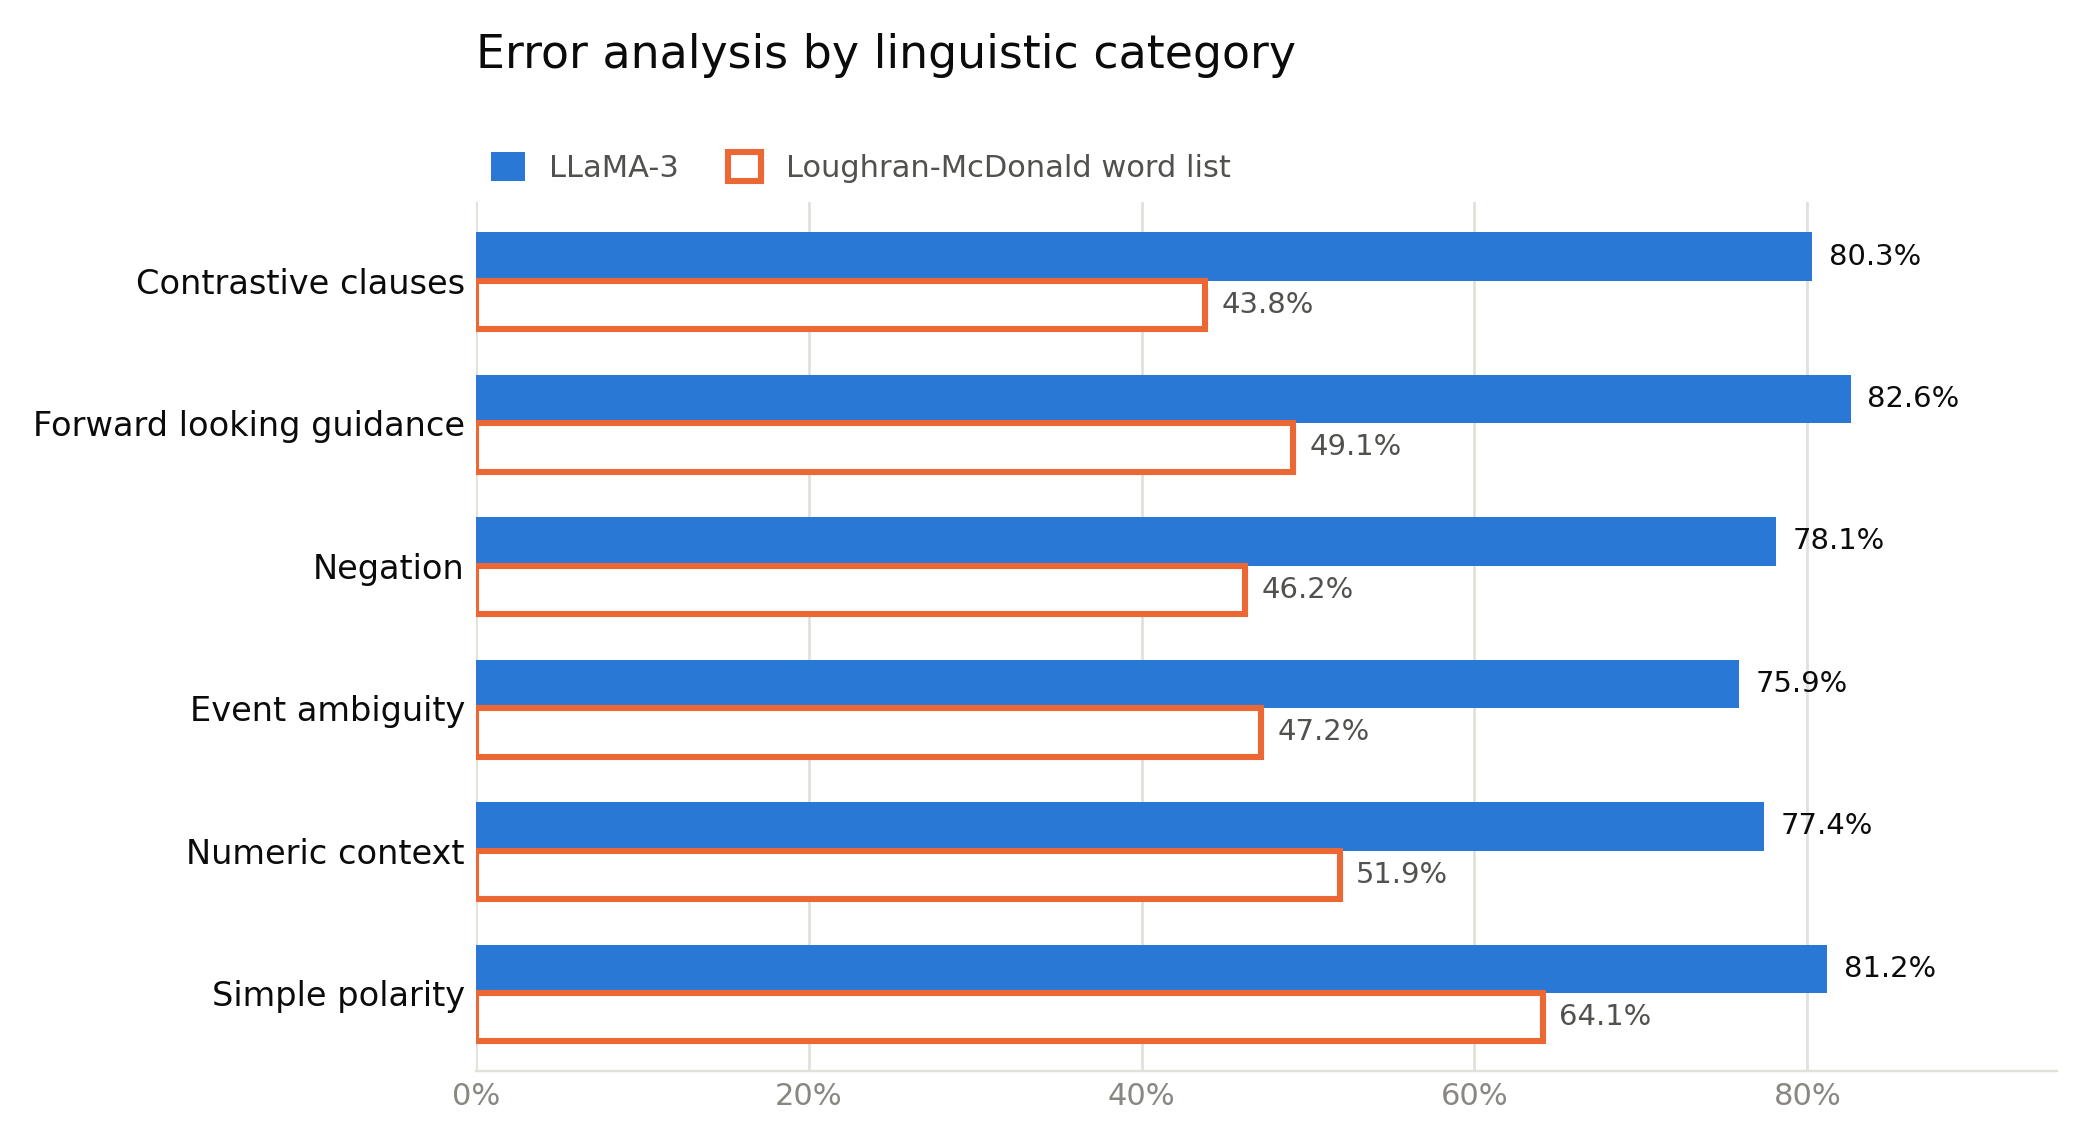
On plainly worded news, a 1980s word list trails an 8 billion parameter model by 17 points. On contrastive clauses (revenue beat, guidance cut) the gap more than doubles to 37, and the word list lands below a coin flip. Sample of 1,200 test articles, coded by two annotators. Chart: Alpha in Academia. Data: Table 13, MFAST working paper (SSRN 7213792).
The more useful result is where that edge comes from. LLaMA-3's advantage over the dictionary is smallest on plainly worded headlines and roughly doubles on negation, contrastive clauses, and forward looking guidance, exactly the sentences where a revenue beat sits next to a guidance cut. It also widens in less liquid names. The lesson for investors is that reading comprehension, not model size, is the thing being sold, and that a signal only counts once costs and capacity are in the room.
Kirtac, Kemal, Financial Language Models as Applied Artificial Intelligence Systems for News-Based Trading under Market Frictions. Available at SSRN: https://ssrn.com/abstract=7213792 or http://dx.doi.org/10.2139/ssrn.7213792
This week for paid subscribers
Paid subscribers are watching the equity correlation matrix collapse onto a single factor across the 2008 and 2020 crashes, then testing whether that same fragility measure warns of a crash in advance. It forecasts the crisis that built up endogenously and is blind to the exogenous one, with the first sustained signal crossing fifteen months before Lehman. Python backtest code included.

Disclaimer: The content provided in this newsletter, "Alpha in Academia," is for informational and educational purposes only. It should not be construed as financial advice, investment recommendations, or an offer or solicitation to buy or sell any securities or financial instruments. Past performance is not indicative of future results. The financial markets involve risks, and readers should conduct their own research and consult with qualified financial advisors before making any investment decisions.
The interpretations, opinions, and analyses presented herein are those of the author and do not necessarily reflect the views of the original researchers, their institutions, or the full implications of the cited academic papers. While every effort is made to accurately represent the research discussed, readers should be aware that the summaries and interpretations may not capture the full scope or nuances of the original studies. The information contained in this newsletter is believed to be accurate and reliable at the time of publication, but accuracy and completeness cannot be guaranteed. The author and publisher accept no liability for any loss or damage resulting from reliance on the information provided.
This newsletter may contain links to external websites or resources. The author is not responsible for the content, accuracy, or reliability of these external sources.
By subscribing to or reading this newsletter, you acknowledge that you have read and understood this disclaimer and agree to hold the author and publisher harmless from any liability that may arise from your use of the information contained herein.