
Recent Academic Research
This week’s best academic research on financial markets

Welcome back to another issue of Recent Academic Research! Let’s get into it.
Fed Chair Sentiment and Bank Crash Risk
The voice sentiment of Federal Reserve Chairs has predictive power for bank stock crash risk
This paper investigates the impact of the vocal sentiment of Federal Reserve Chairs during press conferences on the future stock price crash risk of U.S. banks. Using a novel measure of voice sentiment derived from deep learning analysis of press conference audio from 2011 to 2023, the study finds that non-textual emotional cues are powerful predictors of downside tail risk.
The central finding is that a more positive vocal sentiment ("happiness") from the Fed Chair significantly reduces banks' future stock price crash risk, while negative vocal sentiments like "sadness" and "anger" significantly amplify it.
The effect is both statistically and economically significant, with even modest shifts in vocal tone associated with large fluctuations in crash risk. The authors establish this causal link through various robustness checks, including instrumental variable analysis and entropy balancing.
The study also reveals that the impact is not uniform: negative emotional cues predominantly affect large banks, whereas positive sentiment mainly reduces crash risk for small banks. These findings highlight that how something is said can be as important as what is said in central bank communication.
Anastasiou, Dimitrios and Katsafados, Apostolos G. and Ongena, Steven R. G. and Tzomakas, Christos, Beyond Words: Fed Chairs' Voice Sentiments and US Bank Stock Price Crash Risk (September 03, 2025). Swiss Finance Institute Research Paper No. 25-72, Available at SSRN: https://ssrn.com/abstract=5475246 or http://dx.doi.org/10.2139/ssrn.5475246
Stocks for Inflation Shocks
Investors can hedge inflation with a basket of inflation robust stocks
This study introduces a novel statistical method to predict the relative performance of individual stocks during positive inflation shocks by creating an "inflation robustness score" for each stock.
The method avoids static assumptions by capturing nonlinear, conditional relationships between firm characteristics and inflation sensitivity, allowing the influence of each attribute to vary across different stocks and time periods. Researchers identify a stock's robustness by comparing its current attributes (e.g., leverage, dividend yield, profitability) to the attributes of stocks that proved either vulnerable or resilient during past inflation events, using the Mahalanobis distance to measure similarity.
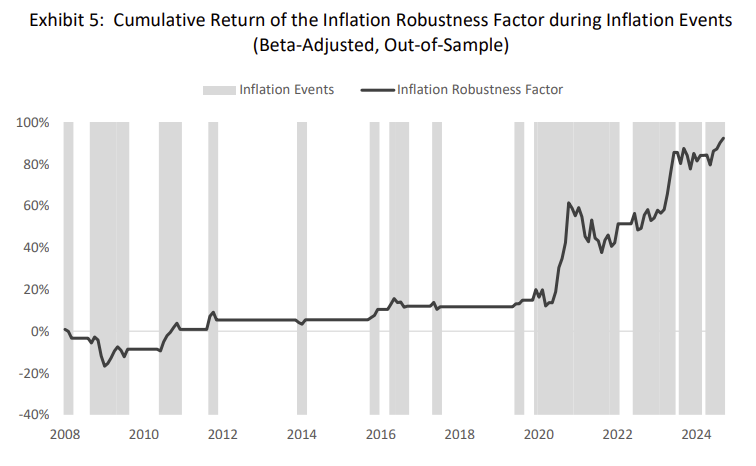
In out-of-sample tests covering 65 U.S. inflation events from 2008 to 2025, these robustness scores are found to reliably predict the cross-section of stock returns. A long-short factor portfolio built from these scores delivered statistically significant outperformance during inflation shocks.
This "inflation robustness factor" remained significant even after controlling for individual firm attributes and sector exposures, suggesting it captures information beyond a simple linear combination of these characteristics. The findings suggest investors can use this adaptive method to construct portfolios that effectively hedge against inflation.
Czasonis, Megan and Li, Ding and Qiu, Grace (Tiantian) and Song, Huili and Turkington, David, Stocks for Inflation Shocks (September 10, 2025). Available at SSRN: https://ssrn.com/abstract=5495340 or http://dx.doi.org/10.2139/ssrn.5495340
Information in Betting Odds Trajectories
Changes in betting odds right before events provide information value
This study examines whether final odds in parimutuel betting markets, specifically Japanese horse racing, are sufficient statistics for predicting outcomes, or if the trajectory of odds contains additional information.
Using high-frequency interim odds data from 2004 to 2023, the researchers find that late-stage odds dynamics, particularly in the final five minutes before a race, are systematically related to expected returns. Horses whose odds decline sharply just before post time (indicating a surge in betting) tend to yield higher returns than horses with identical final odds but different trajectories. This effect is not observed in earlier betting windows.
The inclusion of these last-minute odds changes significantly weakens the well-known favorite-longshot bias (FLB), suggesting that static models relying solely on final odds may misinterpret market dynamics and produce biased estimates of bettor preferences.
The findings provide direct empirical support for information-based explanations of the FLB, where informed bettors strategically delay their wagers, causing final odds to contain a "surprise" component that does not fully aggregate all available private information.
Are Final Market Prices Sufficient for Information Aggregation? Evidence from Last-Minute Dynamics in Parimutuel Betting. Hiroaki Hanyu, Shunsuke Ishii, Suguru Otani, Kazuhiro Teramoto. https://arxiv.org/abs/2509.14645
Predicting Extreme Stock Returns
Machine learning models can help predict extreme long-term stock returns
This study investigates whether a broad set of accounting fundamentals and market-based variables can predict extreme long-term stock returns, distinguishing between massive gains ("rockets") and severe losses ("torpedoes").
The authors employ a two-stage machine learning framework based on Beneish et al. (2001), first identifying firms prone to any extreme outcome and then classifying them as likely winners or losers. Using 45 predictors on U.S. equities, the XGBoost and Random Forest algorithms demonstrate strong predictive performance, significantly outperforming traditional models.
The key finding is that the model's predictions have significant long-term economic value. In out-of-sample tests from 2013–2025, a portfolio of predicted "rockets" earns steadily rising Fama-French five-factor adjusted abnormal returns, while predicted "torpedoes" suffer persistent underperformance.
The spread in cumulative abnormal returns between the two groups exceeds 100% over a 750-trading-day (approximately three-year) horizon. The findings confirm that a systematic analysis of fundamentals, enhanced by modern machine learning techniques, can successfully identify firms at the tails of the return distribution over extended periods.
Wang, Richard and Liu, Yi, Predicting Extreme Returns with Fundamentals: A Machine Learning Approach (September 12, 2025). Available at SSRN: https://ssrn.com/abstract=5475406 or http://dx.doi.org/10.2139/ssrn.5475406
Feedback
Thank you for reading this week’s edition of Recent Academic Research. Remember to fill out the poll to let me know which paper was your favorite and like the post if you enjoyed it.
Feel free to follow up with any questions, comments, or ideas for the future!
Disclaimer
The content provided in this newsletter, "Alpha in Academia," is for informational and educational purposes only. It should not be construed as financial advice, investment recommendations, or an offer or solicitation to buy or sell any securities or financial instruments. Past performance is not indicative of future results. The financial markets involve risks, and readers should conduct their own research and consult with qualified financial advisors before making any investment decisions.
The interpretations, opinions, and analyses presented herein are those of the author and do not necessarily reflect the views of the original researchers, their institutions, or the full implications of the cited academic papers. While every effort is made to accurately represent the research discussed, readers should be aware that the summaries and interpretations may not capture the full scope or nuances of the original studies. The information contained in this newsletter is believed to be accurate and reliable at the time of publication, but accuracy and completeness cannot be guaranteed. The author and publisher accept no liability for any loss or damage resulting from reliance on the information provided.
This newsletter may contain links to external websites or resources. The author is not responsible for the content, accuracy, or reliability of these external sources.
By subscribing to or reading this newsletter, you acknowledge that you have read and understood this disclaimer and agree to hold the author and publisher harmless from any liability that may arise from your use of the information contained herein.