

Reviewed and updated 26 July 2026
Hello!
Welcome back to another post. This will be the start of a two-part series. A few weeks ago, we talked about how you can view prediction markets (like Kalshi and Polymarket) as derivative markets.
Specifically, these prediction markets resemble exotic options, like digital options, digital range options, and one-touch options.
In this series, I will create an application (through Streamlit) which you can run to model these markets as exotic options, and the option Greek exposures that you would have from a position in these markets.
In addition, I will show how you can compare market prices with model-implied values while keeping the model’s assumptions and limits in view. The code for this post is available in the research companion at the end.
Let’s get into it.
Choosing a Market
First, we have to choose a specific market to model. While this idea can be applied to almost all prediction markets (except for markets like mentions or politics)
We will focus on the Daily High Temperature markets on Kalshi. To be specific, we will be focusing on the Los Angeles market, but this will only be pertinent in the next post. I chose this market over others as we get to model both digital options and digital range options. We unfortunately don’t get to model one-touch options, but those are more complex, and likely better suited for a future post if there is enough interest.
In this teaching framework, I use the forecast high temperature as a model state variable (the “Spot” input), while the realized high temperature determines settlement. Unlike a stock, the forecast itself is not a tradable asset, so this is an analogy rather than a directly hedgeable Black–Scholes market.
Temperature markets possess a fundamental difference from equity markets that directly impacts option pricing: Mean Reversion vs. Geometric Brownian Motion.
The standard Black–Scholes model assumes geometric Brownian motion for a tradable asset, while temperature is physically bounded and mean-reverting. If the average July high is 85°F, an outcome of 115°F belongs far into the tail of the temperature distribution; that distribution should be estimated from weather data rather than borrowed literally from an equity model.
Because temperature cannot move to infinity, the tails of a temperature distribution can behave very differently from those of the Black–Scholes process. The digital-option formulas below are therefore most useful for understanding payoff shapes and sensitivities. A literal probability estimate would require a calibrated forecast-error or terminal-temperature distribution.
To apply our model, we define the variables as follows:
Underlying (Spot): The current consensus forecast, calculated from the current digital option and digital range option prices (we will go more into this next post).
Strike (K): The temperature threshold defined by the Kalshi contract (ex. >90°F or 88°F - 89°F).
Payout: A fixed $1.00 if the condition is met, and $0.00 otherwise.
By framing the market this way, I can use digital-option tools to compare payoff shapes and model sensitivities without treating the analogy as a guaranteed arbitrage.
Digital and Digital Range Options
To value these prediction markets, we use the Black-Scholes model for Digital Options. While standard “vanilla” options have a payoff that increases the further the stock moves past the strike, digital options have a fixed, “all-or-nothing” payoff.
The Pricing Model
For a cash-or-nothing digital call, the Black–Scholes price is the discounted risk-neutral probability of finishing above the strike: exp(-rT) × N(d₂). With the article’s assumption that the interest rate is 0%, the discount factor equals one.
Mathematically, assuming interest rates (r) are 0%, the price is:
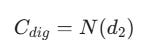
Where N(d2) is the cumulative distribution function of the standard normal distribution, and d2 is calculated as
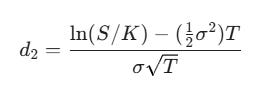
A Kalshi quote such as $0.65 is probability-like, but it is not automatically the model’s N(d₂). In the Black–Scholes analogy, N(d₂) is a risk-neutral model output; applying it to a temperature contract requires a defensible state variable, distribution, calibration, and settlement mapping.
Digital Call Payoff
A Digital Call (or “Threshold” contract) pays out if the temperature exceeds a specific strike.
At Expiry: The payoff is a “Step Function.” For the strict-above-100 example used here, it is worth $0.00 at and below 100 and $1.00 only above 100. There is no middle ground.
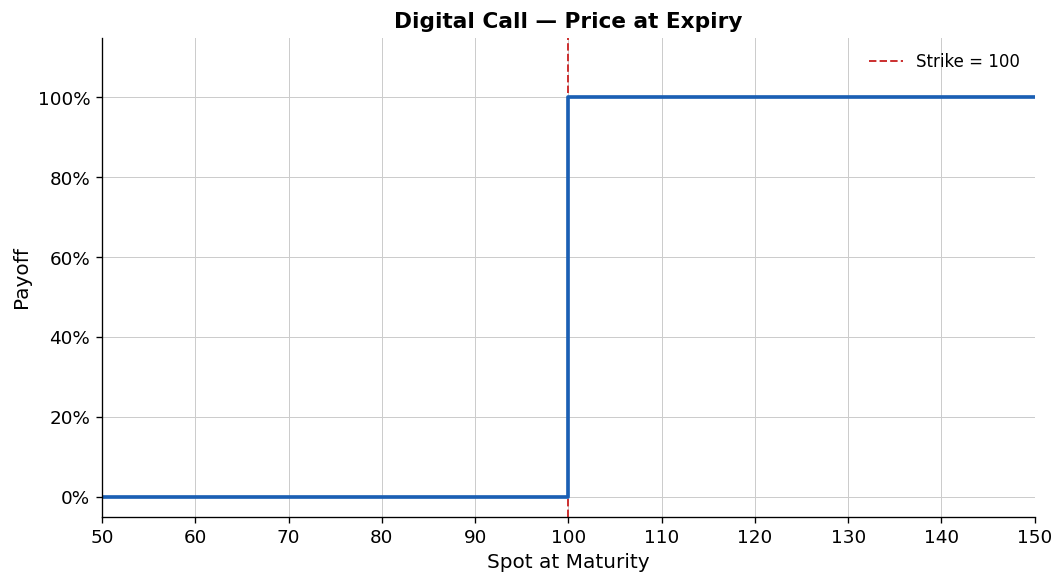
Digital-call payoff at expiry: zero at and below 100, one above 100.
1 Year to Expiry: With one year to go, the “cliff” is smoothed out into an S-curve (Sigmoid). This represents the uncertainty; even if the current spot price is 80, there is still a statistical chance it could reach 100 in a year.
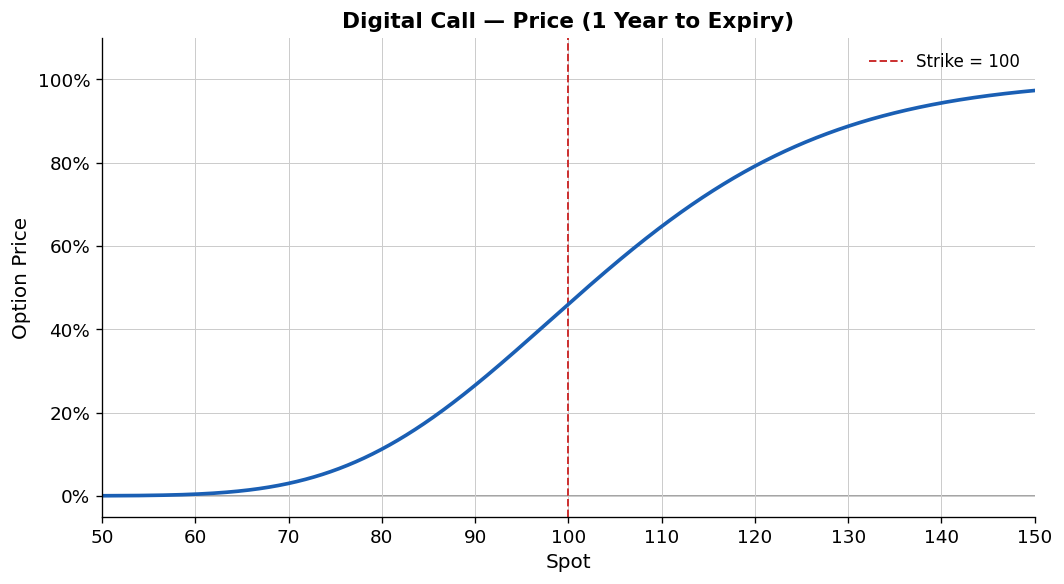
One-year digital-call model price, including the 46.02% value at a state input of 100.
Digital Range Payoff
A Digital Range option (or “Between” contract on High Temperature markets) pays out only if the temperature finishes inside a specific window (e.g., between 90°F and 110°F). You can think of this as a Digital Bull Spread: you are Long a Digital Call at 90 and Short a Digital Call at 110.
At Expiry: The payoff is a “Rectangle” or “Box.” If the spot price is 89 or 111, the contract is worthless.
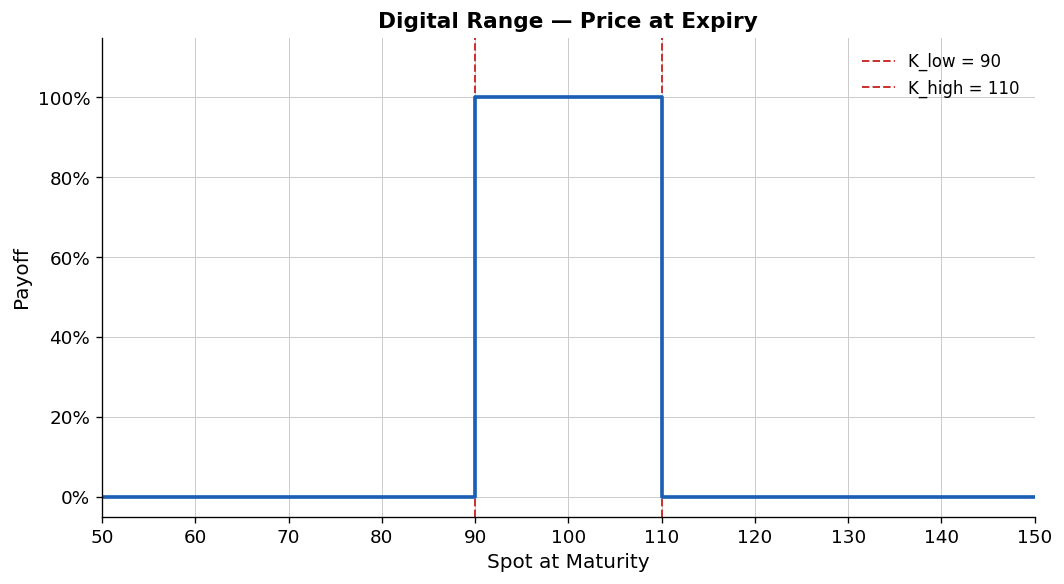
Digital-range payoff at expiry: one strictly inside the 90–110 interval and zero outside.
1 Year to Expiry: The curve is bell-shaped. Under the assumptions shown here, its maximum is near 101.509, slightly above the midpoint of the two strikes. This is the “safest” region for the option to remain inside the range as time passes.
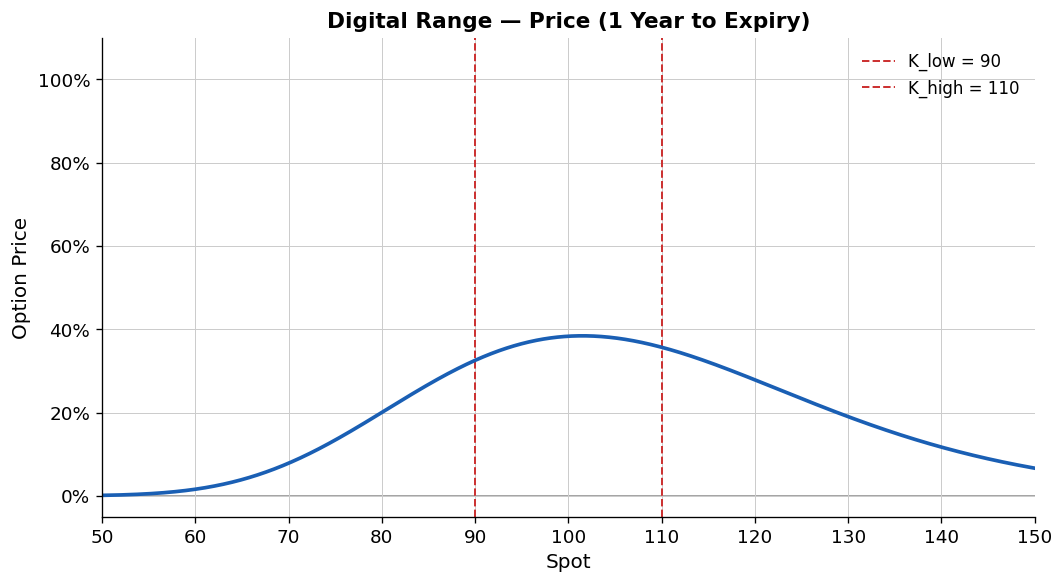
One-year digital-range model price, with its maximum slightly above the interval midpoint.
Pin risk is the primary danger in these markets. If the modeled state is hovering around the settlement boundary as expiry approaches, the contract value can change sharply between $0 and $1. In the model, the local sensitivities become extremely concentrated near the “cliff.” Because a temperature forecast is not a tradable spot asset, these Greeks describe model sensitivity rather than a directly executable hedge ratio.
Exotic Greek Exposures
Managing risk in prediction markets requires a departure from vanilla options intuition. Because these contracts have a fixed payout, their Greeks are characterized by “spikes” and “sign flips” rather than the relatively smooth curves seen in standard equity options.
Note on Scaling: In the following graphs, the y-axis is scaled to the 1-month-to-expiry lines. As time (T) approaches zero, digital Greeks are mathematically explosive. For example, their near-boundary peaks grow sharply as expiry approaches: the Delta peak scales approximately with 1/√T and the Gamma extrema approximately with 1/T. On the 1-day lines, these values often shoot off the chart; I have truncated them here to ensure the 1-month and 1-year profiles remain visible.
Digital Option Delta: A Density-Shaped Sensitivity
In the Black–Scholes model, the digital-call price is a discounted risk-neutral probability. Delta is the first derivative of that model price with respect to the chosen state variable.
Because the price is a discounted cumulative distribution, Delta is a density-shaped sensitivity scaled by exp(-rT)/(Sσ√T), rather than the probability density alone.
Delta peaks near the settlement boundary because that is where the model price is most sensitive to a change in the state variable. With the one-year, 20% assumptions used here, the peak is slightly below the 100 strike; deep in or out of the money, Delta is near zero.
At expiration, the price becomes a discontinuous step function. In the limiting mathematics, its derivative is a Dirac delta concentrated at the strike. This captures the extreme local model sensitivity at the settlement boundary; it should not be read as a directly tradable hedge ratio for temperature.
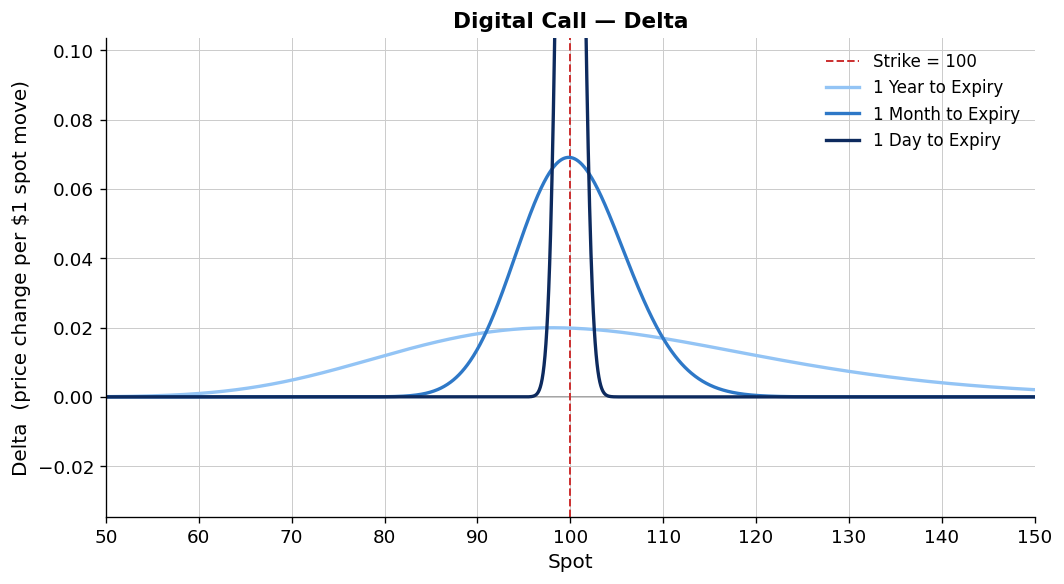
Digital-call Delta becomes increasingly concentrated near the settlement boundary as expiry approaches.
Digital Option Gamma, Vega, and Theta
Unlike vanilla options, digital-option Gamma, Vega, and elapsed-day Theta can change sign around the settlement boundary rather than keeping one sign across the full state range.
Gamma: Gamma is the derivative of Delta with respect to the state variable. It is positive while Delta is rising toward its local peak and negative after Delta begins to fall. The sign change occurs near—but not necessarily exactly at—the strike; under the one-year assumptions shown here it is around 98.02.
As you can see, the 1-day gamma goes off the chart, like delta does in the prior graph. This is because of how delta is very large when the digital option is near the spot price.
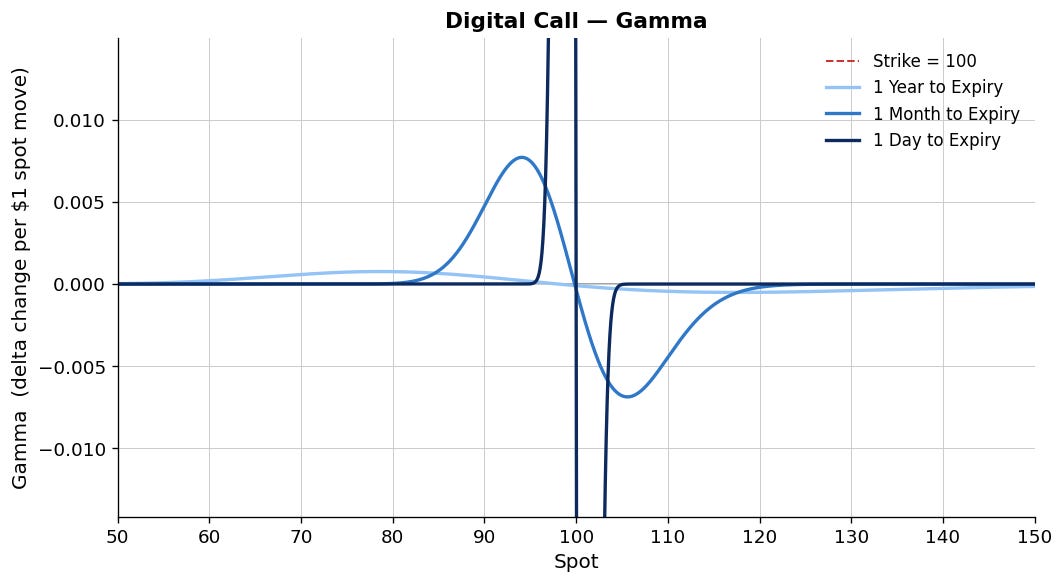
Digital-call Gamma is positive and then negative around the boundary.
Vega: Volatility is a “double-edged sword” for digitals. Below the sign-change region, higher volatility can increase the model value; above it, higher volatility can reduce the model value. The boundary depends on the model parameters and approaches the strike as expiry shortens.
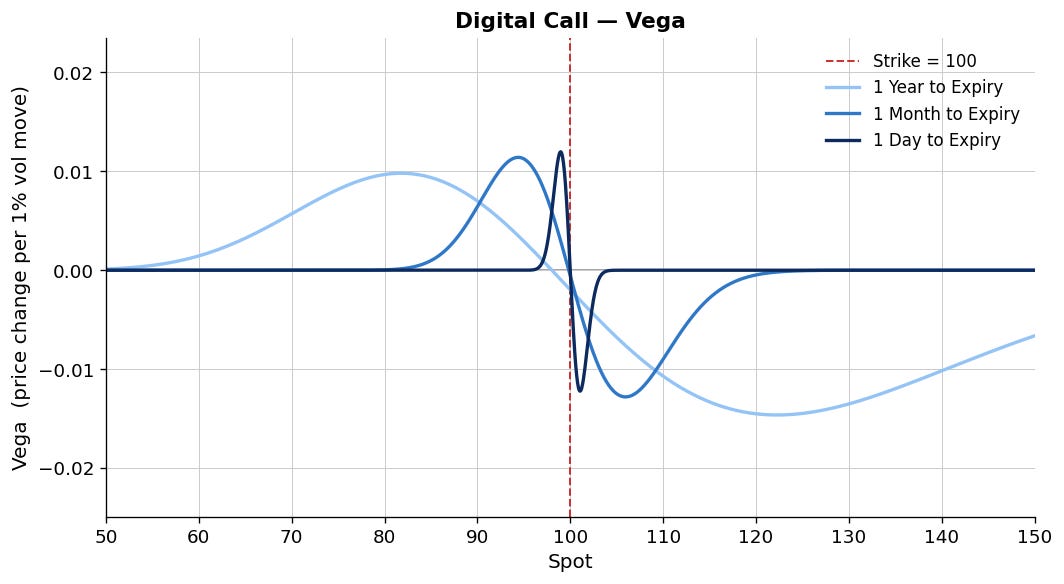
Digital-call Vega changes sign near the boundary.
Theta: Using the elapsed-day convention in the companion, Theta also changes sign around the settlement boundary. Its sign depends on the state, time to expiry, volatility, rates, and the precise convention used.
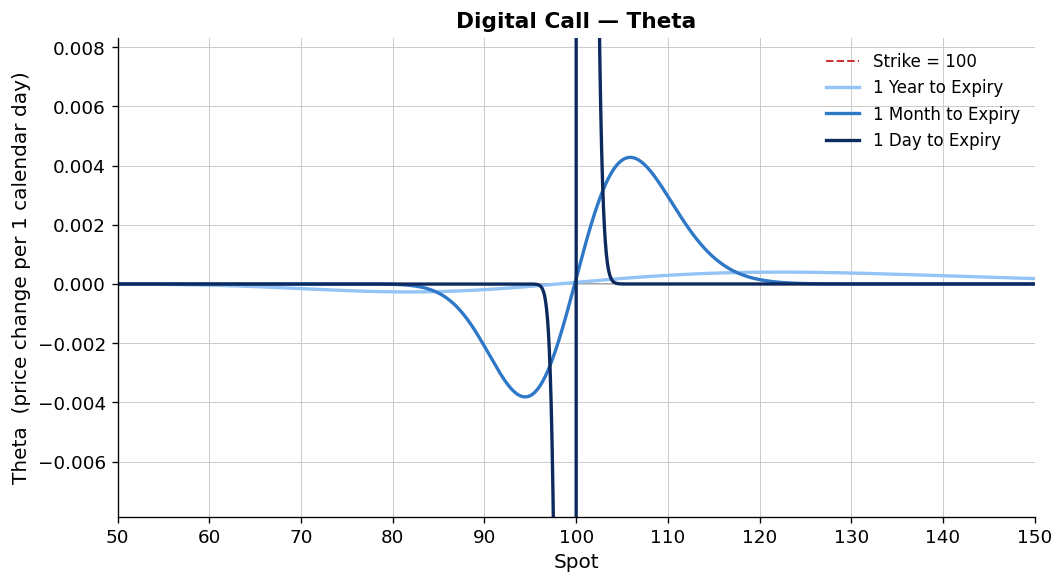
Elapsed-day digital-call Theta changes sign near the boundary.