
LETFs: Harvesting Decay With Two LETFs
[WITH CODE] Evaluating the performance of 'Dual Short' vs. 'Short Bear' strategies in a high-interest rate regime.

Reviewed and updated 20 July 2026
Hello!
Welcome back to another market investigation. Today, we will be building upon our prior post, LETFs: Strategy to Harvest Decay, by covering potential pitfalls and showing how we can improve the overall strategy.
I’ll first cover some research papers that are directly applicable to the strategy that I test in this post. Then, I’ll showcase the backtests that I ran and compare how several two-fund constructions behaved under the same framework.
Let’s get into it.
Research Insights: Dual LETF Shorts
To understand the mechanics of volatility trading, we examined two foundational papers that analyze Leveraged ETFs (LETFs). While both study the same assets, they reach fundamentally different conclusions on how to trade them.
Paper 1: Investment Performance of Shorted Leveraged ETF Pairs
Jiang and Peterburgsky (2013) simulate hypothetical triple-leveraged bull and bear fund returns from 1963 through 2010. Their highest average annual Sharpe ratio, 1.3004, comes from shorting the bull and bear funds in a 1:2 allocation (33.3%:66.7%), holding Treasury bills, and using a wide rebalancing band. They report that this specification outperformed the market in 43 of 48 simulated years. This is a historical simulation, not a test on a modern tradable ETF pair.
Paper 2: Investigating Long-Term Short Pairing Strategies for LETFs
In contrast, Khadivar et al. (2024) study historical LETF data from 2012 through 2020. Their mixed bull-and-bear short portfolios are never selected as the winning strategy in their quarterly or annual comparisons, while the full bear-short portfolio performs best most often, particularly after heightened volatility. Their machine-learning work identifies variables associated with which portfolio wins; it does not prove that shorting bear LETFs will remain optimal.
Pitfalls but Improvement with Tests
These opposing conclusions present a problem, but also suggest improvements based on the strategy in my last post. The studies use different data, portfolios, rebalancing rules, and cost treatments, so they are not a clean head-to-head test. I therefore compare several related constructions using more recent ETF data. The figures below cover 2022–2025 and use my stated cash-rate, borrow-rate, and rebalancing assumptions; they do not include an explicit trading-cost or slippage charge.
Backtesting the Papers’ Strategies
Like last post, I want to focus on the current “high” interest rate regime (2022-2025). This is because LETFs decay from interest rates due to the cost that they have to pay for leverage (at least, some of them. More on that later). However, it is still important to understand how they behaved during the QE, low-interest rate environment of the 2010s.
The first thing I did was replicate the strategy from last week (25% Short UPRO, 75% Long SPY) with TQQQ and QQQ. This changes the index to the Nasdaq 100, which is slightly more volatility (but also with higher returns historically).
If you want a refresher on the strategy details, the prior post explains it in depth.
Before I show the backtest, I want to explain a few logistical changes that I made in the backtest system. To make this simulation distinct from theoretical papers, I upgraded the backtesting engine to support multiple “Modes” (allowing us to toggle between UPRO/SPY, TQQQ/QQQ, and other pairs) and, more importantly, to reflect reality.
First, I adjusted the cash accounting: interest is now earned on your uninvested equity, and not on the short sale proceeds (which retail brokers typically keep). Before this, I assumed that we earned no interest on cash in the backtest. To be accurate with earned interest, I used Federal Funds Rate data to calculate daily interest income, rather than assuming a static rate across 15 years.
Additionally, this rate data lets me separate two ratios that can otherwise be confused. The figures call CAGR divided by annualized volatility the “dirty” ratio. They call (CAGR minus the average Federal Funds rate) divided by annualized volatility the “clean” ratio. The second adjusts for cash yield, but it is still a source-style ratio rather than the conventional Sharpe based on the mean of periodic excess returns. Because these strategies have very low estimated volatility, either ratio can become unusually large.
The cash-rate adjustment makes the opportunity cost visible: a smooth strategy can look exceptional until I compare it with the return available on cash. Under the source-style calculation, the prior strategy—short 25% UPRO and long 75% SPY—turns negative. I will keep the original figure labels below so they match the charts, but I will refer to them as the source-style excess-return ratio and the CAGR-to-volatility ratio.
Now, onto the TQQQ/QQQ backtest. Like before, we short TQQQ with 25% of the portfolio, and long QQQ with 75% of the portfolio, with rebalancing bands of 23% and 26% for the short TQQQ exposure.
Short TQQQ/ Long QQQ (25%:75%) Backtest (2022-2025):
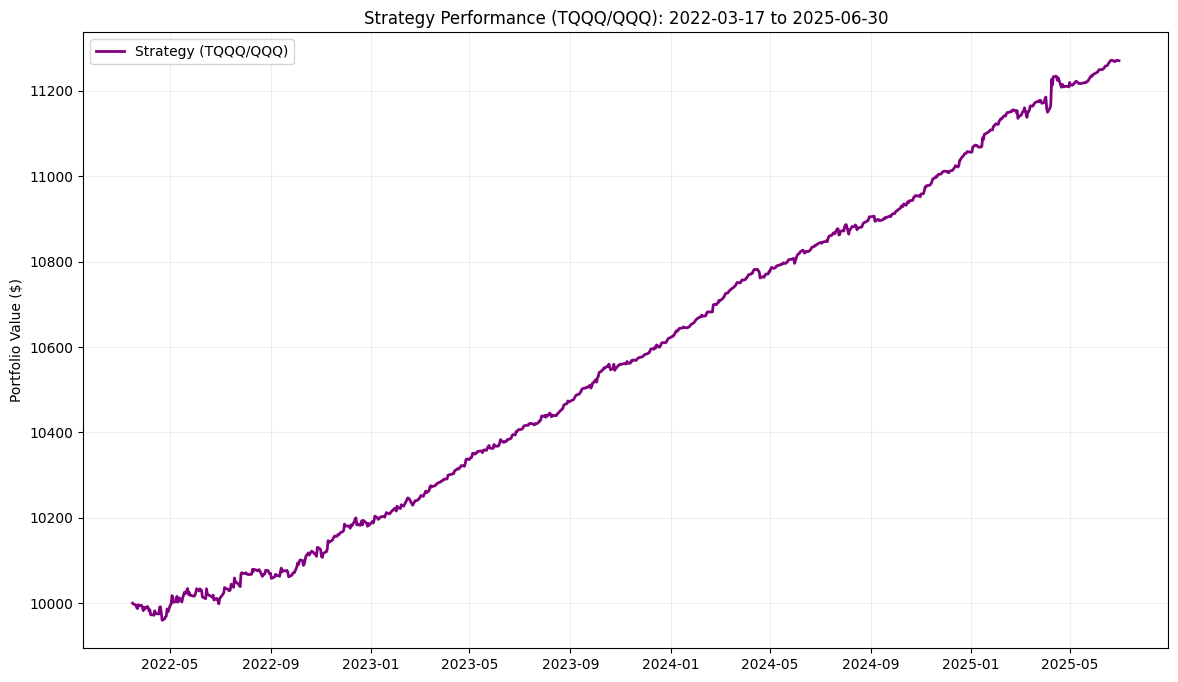
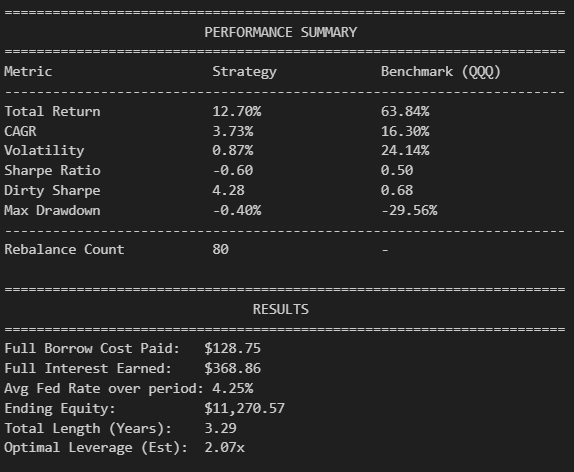
In the saved run, the CAGR-to-volatility ratio for TQQQ/QQQ (4.28) is higher than for UPRO/SPY (4.00), while the source-style excess-return ratio is lower for TQQQ/QQQ (-0.60) than for UPRO/SPY (-0.37). Overall, the two simulations look similar under these assumptions.
While this does not improve the strategy, it shows a similar pattern in one related historical simulation. It does not establish that either result will persist.
Keep reading with a 7-day free trial
Subscribe to Alpha in Academia to keep reading this post and get 7 days of free access to the full post archives.