

Reviewed and updated 20 July 2026
Hello!
Today, I will be investigating four more calendar anomalies in the market. This is a continuation of last week’s post on calendar effects. Once again, thank you all for the recent support. I am glad that you (my readers) enjoy exploring the performance of behavioral biases and calendar anomalies in the market just as much as I do.
Let’s get into it.
Paper Introduction
Most of this introduction section is the same as in Part 1. I chose to include this for new paid subscribers and for those who do not fully remember the paper and the structure of my backtests.
In the Recent Academic Research post on January 25, 2025, I featured a paper by Hussein Mohamed on index calendar anomalies. I have attached my summary of the paper below, and the full paper can be found here.1
Summary of “Time-Based Trading Patterns”
This paper examines time-based trading patterns across major stock indices. Its results vary by index and by anomaly. For the S&P 500 specifically, the regression reports significant positive coefficients for the Halloween, Turn-of-the-Month, options-expiration, and Friday effects; a significant negative coefficient for the pre-holiday effect; and a weaker negative Monday coefficient at the 10% level. The FOMC, sports, January, and September coefficients are not statistically significant for the S&P 500.
The S&P 500 interaction between FOMC meetings and the Halloween period is also not statistically significant. The backtests below ask separate trading-rule questions; they are not direct reproductions of the paper’s regression definitions.
Today, I’ll be analyzing four of the calendar effects described in the paper. While I tested these anomalies using only the S&P 500, the paper suggests that some effects may be more pronounced in small- or mid-cap stocks.
Below, you’ll find the performance metrics for the S&P 500 over the backtest period (1/4/2000 to 12/31/2024). Note that all backtests assume no reinvestment of dividends, which is why the growth, CAGR, annualized mean return, and Sharpe ratio may appear lower than expected.
S&P 500 Buy and Hold Metrics
Growth of $12: 4.04
CAGR: 5.75%
Annualized Mean Return3: 7.48%
Annualized Standard Deviation4: 19.39%
Sharpe Ratio5: 0.39
Each strategy’s performance will be compared against the S&P 500 for full transparency. All backtests were run from January 2000 to December 2024.
I could easily triple the length of this post by outlining all the possible ways to refine these strategies. However, I want to keep things concise and actionable. I highly encourage you to experiment with different backtest periods, underlying ETFs, and stocks—especially S&P 400 mid-cap and S&P 600 small-cap stocks, which may show stronger effects.
While some of these anomalies may not perform well with large-cap U.S. stocks, they could generate much higher returns in specific sectors or international markets. If there’s demand, I’m happy to do a deep dive into refining and optimizing a specific calendar anomaly in a future post.
Recap of Prior Calendar Anomalies
Last week, I tested several well-known calendar anomalies from academic research, comparing their performance against the S&P 500. While some anomalies showed strong risk-adjusted returns, others failed to hold up under historical testing.
Halloween Effect (”Sell in May and Go Away”) – This strategy, which buys in November and sells in May, showed solid risk-adjusted outperformance with a Sharpe ratio of 0.59. However, the edge appears to have faded post-COVID. Some research suggests the effect is stronger in midterm election years.
Turn of the Month (TOM) Effect – This strategy, which buys the S&P 500 on the last trading day of the month and holds through the first three days of the next month, posted steady and consistent returns with a Sharpe ratio of 1.19. Unlike other anomalies, this effect did not show signs of decaying over time.
Monday and Friday Effects – Prior research suggests Mondays underperform while Fridays outperform. However, my backtests tell a different story—both Monday and Friday strategies had weak returns, contradicting prior literature. Instead, Tuesdays and Thursdays contributed the most to total S&P 500 returns during the backtested period.
January and September Effects – The January effect (historically strong January returns) completely fell apart, showing negative performance and a Sharpe ratio of -0.08. On the other hand, the September effect (historically weak September returns) held up well, with September producing the worst monthly returns.
Now, let’s dive into Part 2.
FOMC Effect
Prior literature6 has shown that Federal Open Market Committee meetings are often coincided with positive returns in the S&P 500. One paper examined FOMC meeting dates from 1960 to 2000 and found positive and statistically significant returns in the S&P 500. Clearly, the decisions of the FOMC are very impactful on the market. However, do these days provide significantly better risk-adjusted returns than other days in the market?
In order to test this effect, I pulled the dates of FOMC meetings for the backtest period from the appendix in the paper. The strategy below takes long positions in the S&P 500 only on days in which FOMC meetings occur.
The meeting-date list does not classify scheduled and unscheduled meetings on a point-in-time basis. I therefore treat this as a retrospective event-date association, not as proof that a position could have been entered before every meeting-day return.
FOMC Effect Visual Backtest
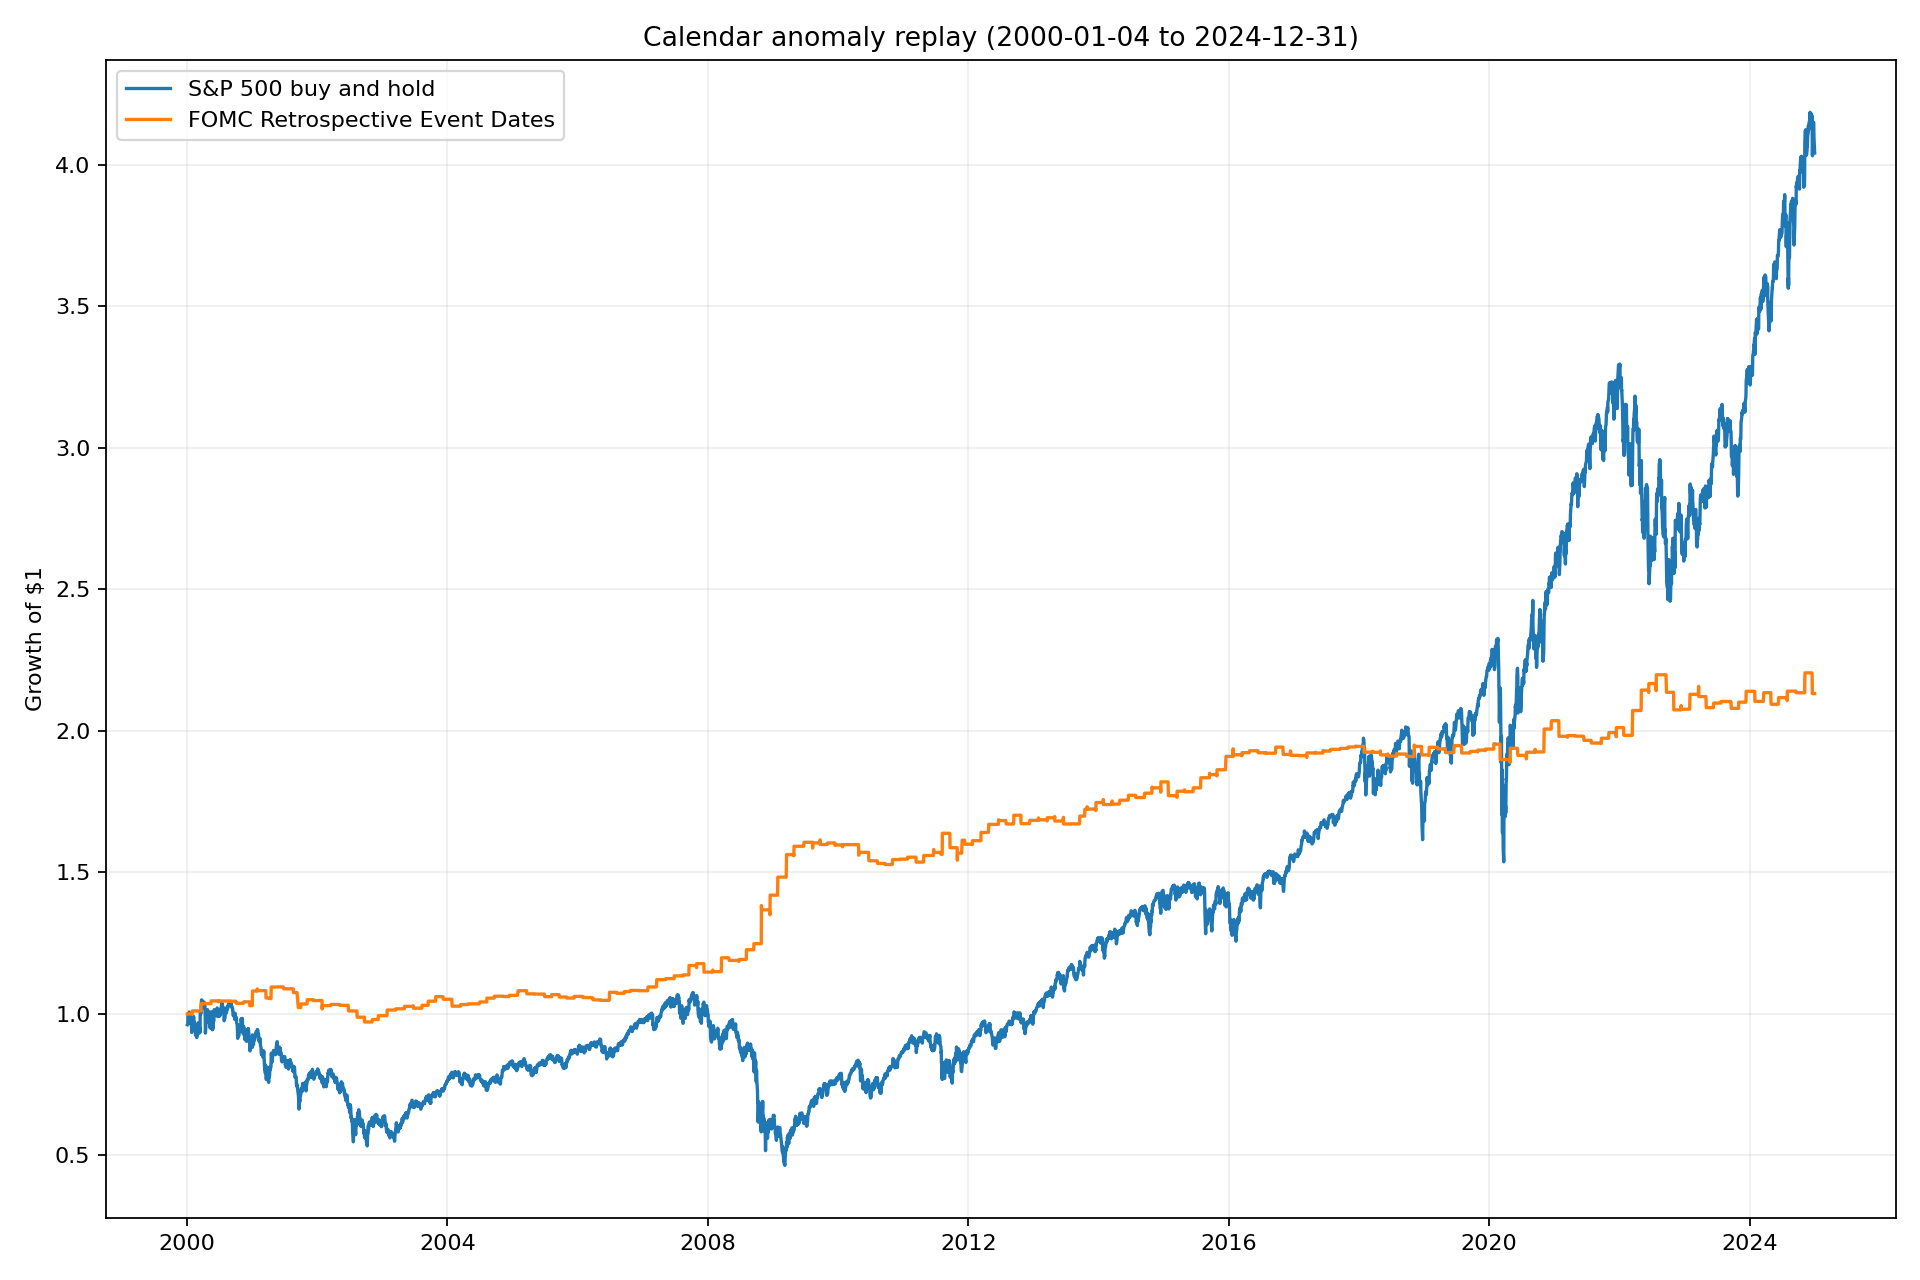
Historical cumulative performance on the supplied FOMC dates and S&P 500 buy and hold, January 2000–December 2024. Cash is set to 0% between active sessions; the date list is retrospective.
FOMC Effect Metrics
Growth of $1: 2.13
CAGR: 3.08%
Annualized Mean Return: 3.16%
Annualized Standard Deviation: 5.03%
Sharpe Ratio: 0.63
This is the strongest retrospective risk-adjusted association in this section. It gained 23.67% across 13 FOMC-date sessions in 2008 while buy and hold lost 38.49%. That crisis-period result is notable, but the date list does not establish point-in-time implementability and one period does not establish a dependable hedge.