

Reviewed and updated 20 July 2026
Hello!
Today I’m looking at a momentum strategy from academic research. The question is whether short- and long-term correlation across commodity markets can tell us when to follow trends and when to switch to reversal.
Let’s get into it.
Paper Introduction
This paper, “How to Improve Commodity Momentum Using Intra-Market Correlation,” written by Radovan Vojtko and Margaréta Pauchlyová (Quantpedia authors), explores an innovative way to enhance momentum strategies in commodity markets. While not traditional academics, the authors bring substantial real-world expertise—Radovan, the CEO and Head of Research at Quantpedia, has managed over €300 million in quantitative funds, adding significant credibility to their insights.
I initially featured this paper in my weekly Recent Academic Research post on November 2nd, where it garnered the highest votes in the reader poll. Given its popularity, I decided to dive deeper and implement the strategy for a comprehensive evaluation.
Here’s my prior summary of the paper:
This paper explains how to use an intra-market correlation filter to improve the performance of momentum strategies in commodity markets, especially given that momentum strategies have been less effective recently.
When the short-term correlation among commodity ETFs surpasses the long-term correlation, it suggests that commodities are trending in a unified direction. This allows momentum strategies to differentiate between winners and losers more effectively. Under these conditions, the paper recommends a momentum strategy that goes long on the top-performing ETFs and short on the underperformers. Conversely, when short-term correlation falls below the long-term correlation, a reversal strategy is recommended. This involves going long on the worst-performing ETFs and short on the best-performing ones.
With that out of the way, let’s replicate the strategy, and see how well it performs.
Paper Strategy Replication
Methodology
I adapted the strategy described in “How to Improve Commodity Momentum Using Intra-Market Correlation.” The paper rebalances monthly and holds positions for one month. My version recalculates positions daily, so it is related to the paper rather than an exact replication. Here is how I implemented it:
Data Source:
All data was sourced from Yahoo Finance using the yfinance Python package, consistent with the paper’s approach.
I focused on the same four ETFs:
DBA(agriculture),DBB(base metals),DBE(energy), andDBP(precious metals).
Data Preparation:
Daily adjusted close prices for each ETF were combined into a single pandas DataFrame.
One date detail: The data used for the headline figures runs from 5 January 2007 through 24 December 2024. The notebook set 1 December 2024 as its end date, but the primary download continued through 24 December. Using the stated cutoff changes total return from 44.03% to 43.65% for the original strategy and from 110.85% to 108.67% for the filtered strategy. The difference is small, but the dates should match the data.
Signal Generation:
Momentum Signal: When the short-term correlation (20-day) exceeded the long-term correlation (250-day) at the end of the trading day:
A long position was initiated for the top two performing ETFs.
A short position was initiated for the bottom two performing ETFs.
Reversal Signal: When the short-term correlation was lower than the long-term correlation:
A short position was initiated for the top two performing ETFs.
A long position was initiated for the bottom two performing ETFs.
Execution:
Positions were updated daily based on the signals generated at the close of the previous trading day.
Trades were executed at the adjusted close price of the next trading day.
Replication Results:
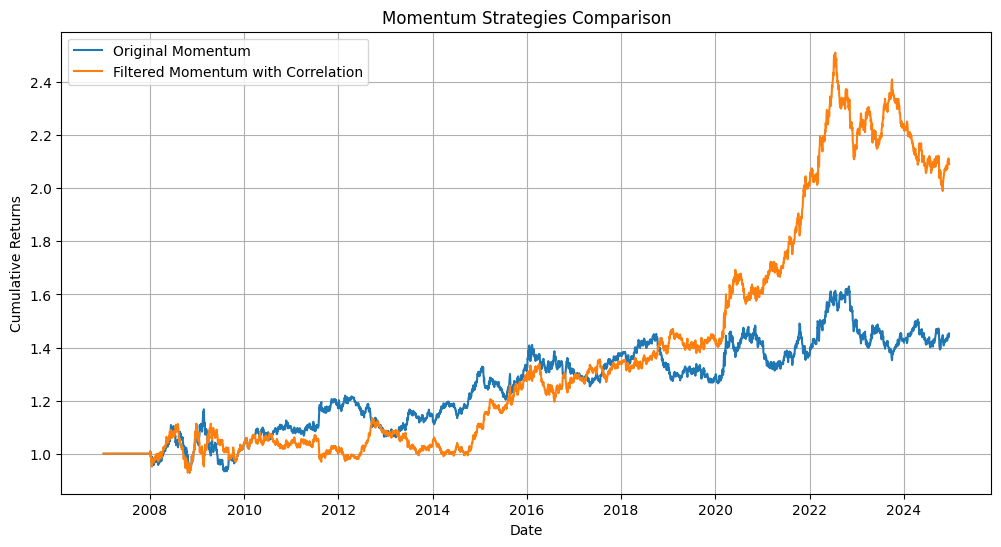
Portfolio Metrics for Original Momentum:
Total Return: 44.03%
CAGR: 2.18%
Standard Deviation: 9.10%
Sharpe Ratio: 0.27
Max Drawdown: -20.04%
Portfolio Metrics for Momentum with Correlation Filter:
Total Return: 110.85%
CAGR: 4.51%
Standard Deviation: 9.10%
Sharpe Ratio: 0.50
Max Drawdown: -20.74%
Interestingly, the results of my replication do not exactly align with those presented in the paper. However, a notable similarity between my results and the paper’s findings is the dip or stagnation in strategy performance starting around March 2022. This period seems to pose challenges for the strategy’s effectiveness.
Interestingly, in my tests, the original momentum strategy performed better than reported in the paper, suggesting that the baseline performance may not be as weak as initially described.