

Reviewed and updated 22 July 2026
Hello!
Today, I’m returning to the format of my first two implemented strategy posts, this time exploring the performance and risk-adjusted returns of well-documented calendar anomalies from academic research.
In my Recent Academic Research posts, I’ve highlighted multiple papers demonstrating how return patterns can appear at specific times of the year.
Because these strategies only trade during small, specific windows throughout the year, none of them alone will outperform the S&P 500 in terms of ending wealth in this test.
The more useful question is how their risk-adjusted returns compare once cash days are counted consistently. They may still be useful signals to investigate, but this one in-sample backtest cannot establish uncorrelated or implementable alpha.
Let’s get into it.
Paper Introduction
In the Recent Academic Research post on January 25, 2025, I featured a paper by Hussein Mohamed on index calendar anomalies. I have attached my summary of the paper below, and the full paper can be found in the Sources section.
Summary of “Time-Based Trading Patterns”
This paper examines time-based trading patterns across major stock indices. Its results vary by index and by anomaly. For the S&P 500 specifically, the regression reports significant positive coefficients for the Halloween, Turn-of-the-Month, options-expiration, and Friday effects; a significant negative coefficient for the pre-holiday effect; and a weaker negative Monday coefficient at the 10% level. The FOMC, sports, January, and September coefficients are not statistically significant for the S&P 500.
The S&P 500 interaction between FOMC meetings and the Halloween period is also not statistically significant. The backtests below ask separate trading-rule questions; they are not direct reproductions of the paper’s regression definitions.
Today, I’ll be analyzing six of the calendar effects described in the paper. While I tested these anomalies using only the S&P 500, the paper examines several U.S. indices and finds that results vary by index.
Below, you’ll find the performance metrics for the S&P 500 over the backtest period (1/4/2000 to 12/31/2024). The backtests use a price index without reinvested dividends.
S&P 500 Buy and Hold Metrics
Growth of $1: 4.04
CAGR: 5.75%
Annualized Mean Return: 7.48%
Annualized Standard Deviation: 19.39%
Sharpe Ratio: 0.39
Each strategy’s performance will be compared against the S&P 500 for full transparency. All backtests were run from January 2000 to December 2024. Annualized mean and volatility use every portfolio session, including 0% cash days, so the Sharpe ratios are comparable on the same basis.
I could easily triple the length of this post by outlining all the possible ways to refine these strategies. However, I want to keep things concise and actionable. I highly encourage you to experiment with different backtest periods, underlying ETFs, and stocks—especially small-cap stocks, where the paper reports different patterns.
Results may also differ across sectors or international markets. Any extension should be tested out of sample and should account for costs, dividends, cash yield, and the number of rules examined.
Halloween Effect (Sell in May and Go Away)
The first effect that I explored was the Halloween Effect. This is also known as the “Sell in May and Go Away” phenomenon. The authors found this effect to be statistically significant for the S&P 500. This is the description of the Halloween Effect by the authors:
“The Halloween effect posits that stock market returns are higher between November and April than during the other months of the year. This seasonal anomaly suggests that investors should buy stocks in late October and sell them in early May, effectively ‘selling in May and going away.’ The rationale behind this strategy is based on historical data showing superior performance during the winter months compared to the summer months.”
Quite a simple idea, and not difficult to implement.
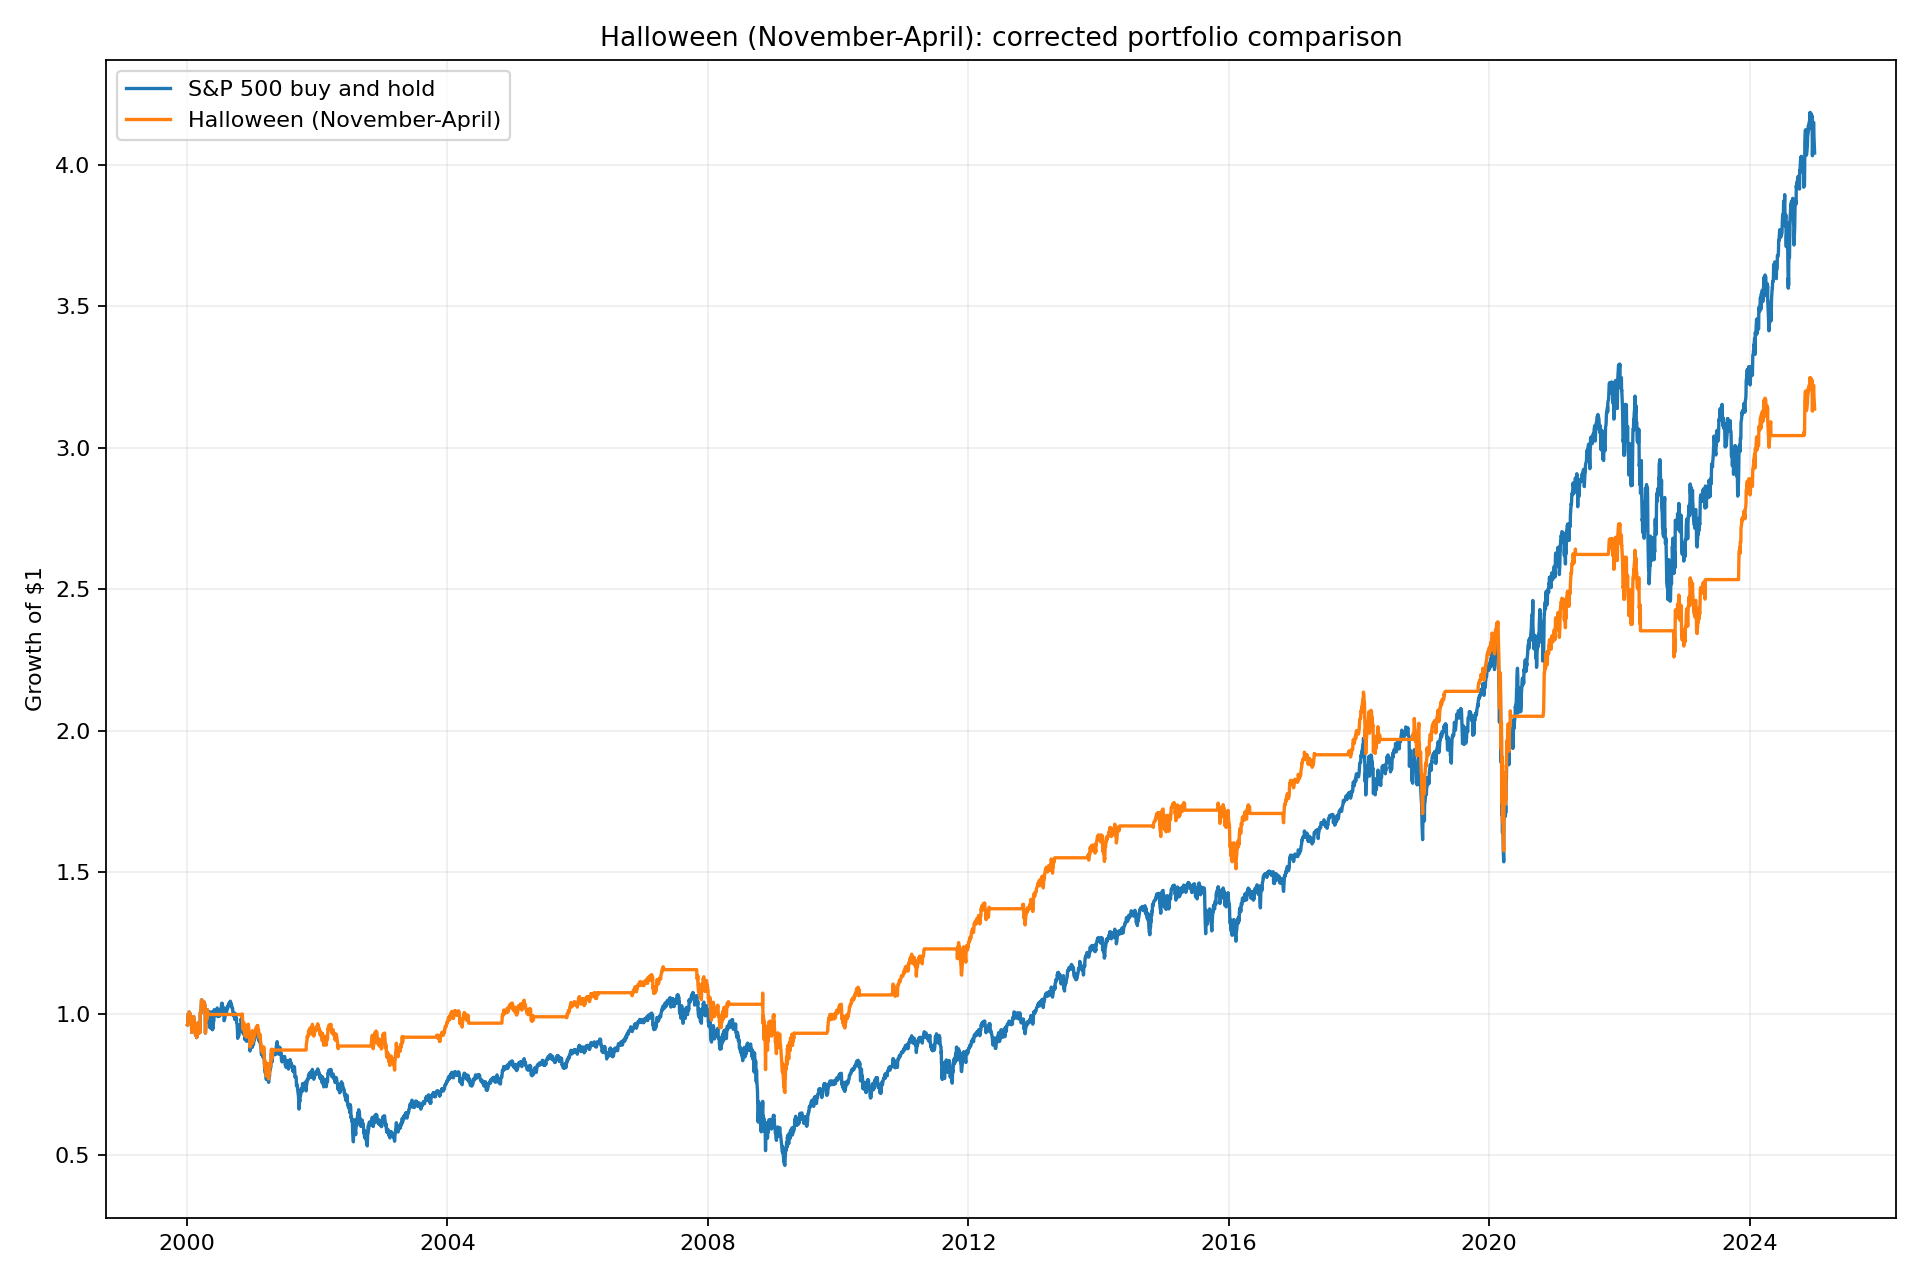
Halloween Effect Metrics
Growth of $1: 3.14
CAGR: 4.68%
Annualized Mean Return: 5.57%
Annualized Standard Deviation: 14.01%
Sharpe Ratio: 0.40
The Halloween strategy finished with a similar Sharpe ratio to buy and hold and lower ending wealth. The chart shows weaker relative performance after 2020, but this backtest does not test whether the effect has structurally decayed.
The code also compares the mean daily return during the Halloween period with the other six months of the year.
Turn of the Month Effect
The Turn of the Month effect states that returns are higher during the last trading day of a month and the first three trading days of the next month. The paper also finds a significant S&P 500 turn-of-month coefficient, although its regression definition uses the first four trading days.