
Convexity of Vega (Volga) Part 2
The Gamma of Vol: Profiting from the Market’s Fear of Fear

Hello!
Welcome to the second and last post in this series. Last post, we showed how LTCM failed due to an extreme tail event, how kurtosis shows up in the markets, and we introduced the option greek Volga.
We also covered some research papers on the topic that show opportunities that are based on tail risks.
Today, we will show exactly where you are exposured to Volga in the options chain, how to create an option structure to trade Volga, and more academic papers.
Let’s get into it.
The Change in Vega for a Change in Implied Vol
From the last post, we know that Volga (also known as Vomma, Vega Convexity, or DvegaDvol) is the option Greek that represents how much Vega will change for a change in implied volatility.
To understand the intuition behind this concept, let’s look at how the Vega profile changes across strike prices as implied volatility (IV) rises or falls. The chart below shows the Vega of options at different strike prices. As you probably already know, the Vega graph looks like a bell curve. However, the shape of this bell curve depends significantly on the current level of IV.
As you can see below, a higher implied volatility causes the wings to expand, meaning OTM options gain significantly more Vega exposure as volatility increases.

We can also view this concept through a different lens. If we take the derivative of Vega with respect to IV across the option strikes, we see that Volga is positive for nearly all options, peaking in the wings and remaining near zero for At-the-Money (ATM) options:

Some may not have thought about the “why” behind this before, so let’s look at the intuition. The Plinko board example is often a good analogy to explain volatility. Imagine dropping balls (stock returns) from the top of the board. In a low-volatility environment, the pegs are close together, and the balls cluster tightly in the center. Because the outcomes are so predictable, an OTM option (a slot far to the side) feels “impossible,” and it has almost no sensitivity to a change in the board’s width (Vega).
However, as you “crank up” the volatility, you are effectively widening the board and spacing out the pegs. Suddenly, the probability of a ball reaching those far-flung OTM slots isn’t just possible, it’s actually accelerating. This is why OTM options have high Volga: as the underlying has a greater chance of reaching those far out strikes, these “lottery tickets” become much more sensitive to further increases in volatility.
You can actually test this out with an option pricing model. I like this calculator online, because it displays the Greeks clearly. While it technically uses the Garman-Kohlhagen model (used for FX options) rather than standard Black-Scholes, the logic is identical. The only difference is that it uses two interest rate inputs instead of a single rate and a dividend yield. Let’s go through a few examples with this calculator:
OTM Call
Let’s choose a 15-delta option for this example, as the wings generally house the greatest Volga. We will use a call, but the effect is the same for an OTM put.
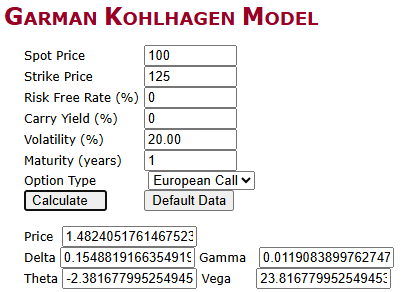
Assume USD/JPY is at 100, and we have a 1-year call with a strike price of 125. For simplicity, assume zero yield for both currencies. At 20% volatility, the option has a delta of ~15 and a Vega of ~24.
However, when we increase the implied volatility to 25%, the Vega rises to ~30:
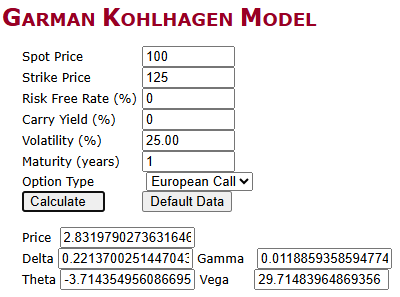
This is the “Vega Convexity” that is so beneficial to those who hold long OTM options. Because you are “Long Volga,” your position scales in your favor: as volatility rises, your Vega exposure grows, so you make more money on the move. Conversely, if volatility falls, your Vega shrinks, meaning you lose less than a linear model would predict. You are essentially “long gamma” but for the volatility surface (this is why Volga is called Volga - it is the gamma of vol (Vol-Gamma)).
ATM Call
I also want to highlight a caveat that I would be surprised if any of you are aware of this. While we often say all long options have positive Volga exposure, this is technically incorrect at the very center of the curve.
Theoretically, ATM options can actually have slightly negative Volga.
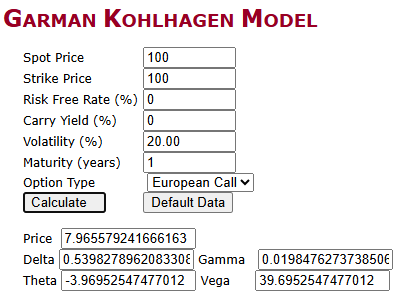
If we use the exact same assumptions as before but move the strike to 100 (ATM) and set volatility at 20%, our Vega is 39.70.
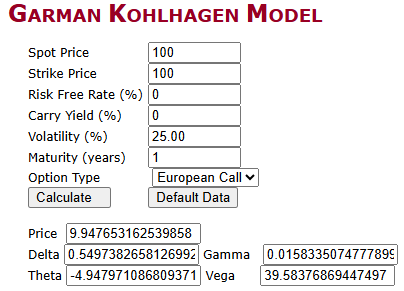
However, if we crank implied volatility up to 25%, our Vega actually falls (ever so slightly) to 39.58.
The intuition for this is a bit abstract, but think of it this way: Vega measures how much “uncertainty” an option has. At-the-money, uncertainty is already at its absolute maximum because you are exactly on the 50/50 line of being in or out of the money. As you increase volatility to extreme levels, the distribution flattens out so much that being “exactly at 100” becomes less special relative to being at 110 or 120. The “peak” of the bell curve spreads out, actually lowering the incremental sensitivity of that specific ATM strike.
Additionally, there is a mathematical drift at play. In a lognormal distribution, as volatility increases, the median price of the distribution drops relative to the mean. This effectively makes your 'At-the-Money' strike behave as if it is slightly Out-of-the-Money, which contributes to that subtle decay in Vega.
The Delta-Hedged, Vega-Neutral Butterfly
A standard long butterfly is a common “retail” structure used to bet on low volatility or a “pin” at a specific price. It is constructed by buying one In-the-Money (ITM) call, selling two At-the-Money (ATM) calls, and buying one Out-of-the-Money (OTM) call.
You can also structure this as an Iron Butterfly using both puts and calls to achieve the same risk profile while potentially managing capital requirements differently.
However, a standard butterfly is not “pure” in terms of trading Volga because it carries significant direction (Delta) and volatility (Vega) risks. If you look at a normal butterfly’s Vega profile, you’ll see it is highly sensitive to the absolute level of implied volatility:
Normal Butterfly Vega Profile:

If you are a professional trader looking to harvest the tail premium, you don’t want to bet on where the stock price goes or whether implied vol simply goes up or down. You want to bet on the shape of the surface. To do this, institutional desks use a Delta-Hedged, Vega-Neutral Butterfly.
By adjusting the ratios of your long wings versus your short body, you can neutralize the position’s overall Vega. Because OTM options have higher Volga (Vega convexity) than ATM options, a Vega-neutral butterfly remains highly sensitive to changes in the “curvature” of the volatility smile. You also manage your deltas (by trading the underlying) in order to remain delta neutral throughout the period of the trade.
For example, if you wanted to get long volga exposure, you would trade a long, delta-hedged, vega-neutral butterfly where you buy more OTM options than you sell ATM options (because ATM options have a higher Vega than OTM options).
In a high-kurtosis regime (where the market begins to fear large, outlier events) the wings of the smile steepen. In this scenario, the Volga kicks in: the “wings” of your butterfly gain value faster than your short “body” loses it. This allows you to capture P&L purely from the market’s realization that the tails are fatter than previously expected, regardless of whether the underlying price remains stable.
Below, we will cover some academic papers on this topic, and I will give personal insight into how institutional trading desks trade these option structures.
Keep reading with a 7-day free trial
Subscribe to Alpha in Academia to keep reading this post and get 7 days of free access to the full post archives.